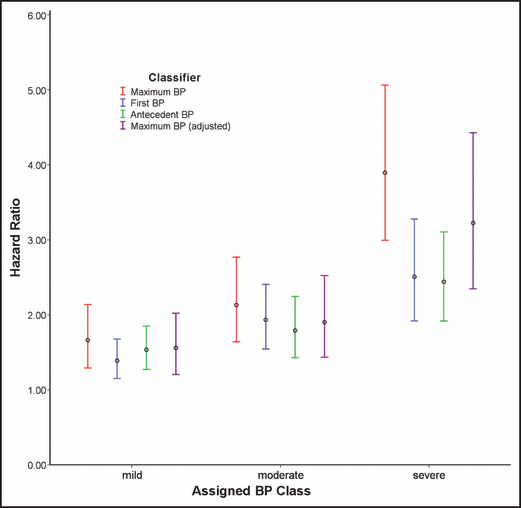
Figure 3.

Blood pressure (BP) classification methodology and associated cardiovascular disease risk. Hazard ratios are compared across BP categories obtained using 3 approaches to classification while adjusting for age, sex, race, diabetes, and hyperlipidemia. Maximum BP assigns categories according to the highest BP achieved historically: First BP according to the first BP recorded on the initial office visit, and Antecedent BP according to the time‐averaged BPs recorded prior to the index date. The fourth model, Maximum BP (adjusted), adjusts for the time‐averaged systolic and diastolic BPs recorded prior to the index date. Normal BP serves as the reference category for all models. Vertical bars indicate 95% confidence intervals.
