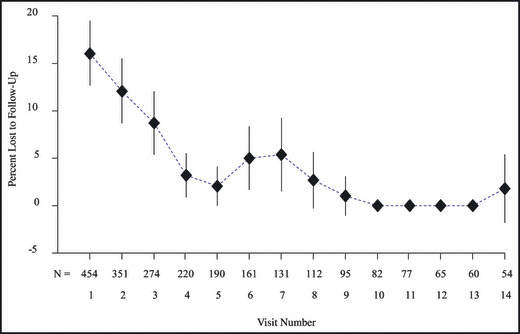
Figure 2.

Distribution of participants lost to follow‐up by clinic visit. Diamonds represent the estimates (prevalence) and the vertical bars the 95% confidence interval. For each visit, the total number (N) of participants who attended is also shown. A linear interpolation line (broken line) has been superimposed to assist interpretation.
