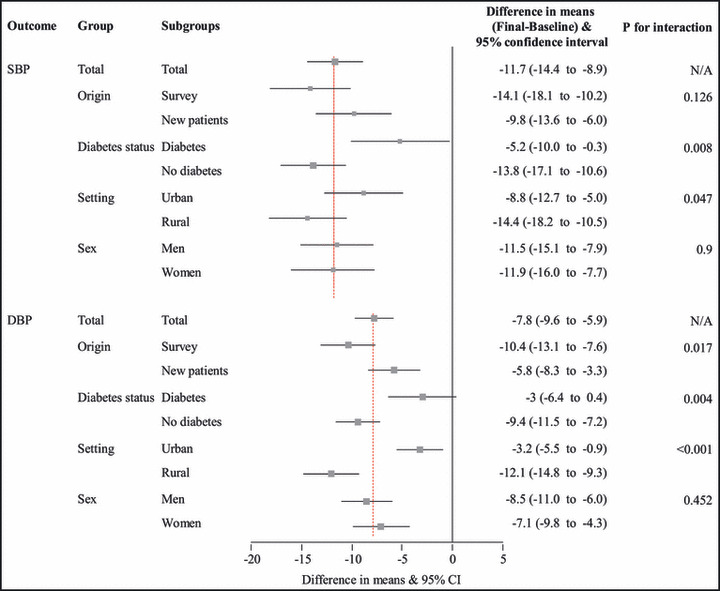
Figure 3.

Forrest plot summarizing the mean changes in systolic blood pressure (SBP) and diastolic blood pressure (DBP) between final and baseline visits, overall and by subgroups. The squares represent the effect estimates (mean differences: final visit value – baseline visit value) and the horizontal lines the 95% confidence interval (CI) of the effect estimates. Sizes of the squares are proportional to the inverse of the variance. The broken vertical lines are for the overall estimates by blood pressure variable. N/A indicates not applicable.
