
Figure 1.
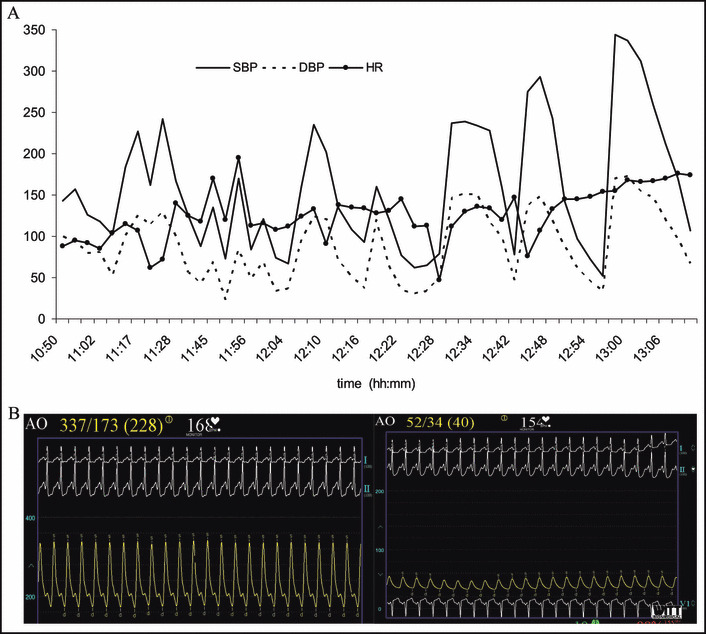
Arterial blood pressure (BP) monitoring shows the cyclic fluctuations of BP during a hemodynamic crisis in the electrophysiology laboratory. (A) A 2‐hour period is shown with fluctuating BP with cycles every 14 minutes. (B) Images of the recording screen with continuous arterial BP and heart rate (HR) monitoring show 2 episodes of severe hypertension and hypotension. SBP indicates systolic blood pressure; DBP, diastolic blood pressure; AO, radial arterial line blood pressure value.