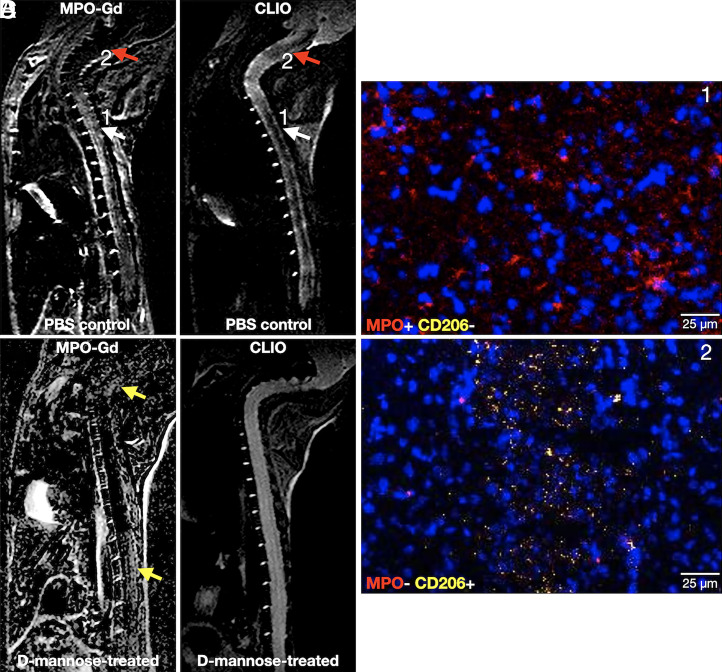
Fig. 4.
Matching MPO-Gd and CLIO imaging of (A) PBS-control and (B) d-mannose–treated EAE animals. In A, MPO-Gd+ lesions with matched CLIO+ lesions (white arrows) represent M1-like phagocytes, corroborated by immunohistochemistry in C, where this area contained cells that expressed MPO but not CD206 (red = MPO, yellow = CD206, blue = DAPI). Lesions that were CLIO+ only without corresponding MPO-Gd+ signal (red arrow) represent M2-like phagocytes that expressed CD206 but virtually no MPO on immunohistochemistry (D). In B, d-mannose treatment markedly reduced CLIO signal in MPO-Gd+ lesions (yellow arrows).

