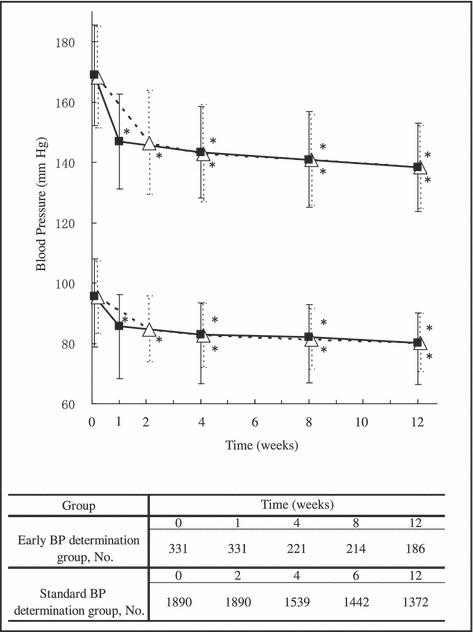
Figure 3.

Time course of changes in blood pressure (BP). Upper and lower symbols represent changes in mean (SD) systolic BP and diastolic BP, respectively. Filled small squares and open large triangles were values obtained from the early determination group and standard determination group, respectively. *Significant (P<.0001) difference vs before treatment by Dunnett’s multiple comparison test. The table at the bottom of the figure shows the number of patients whose BP was determined at each time point.
