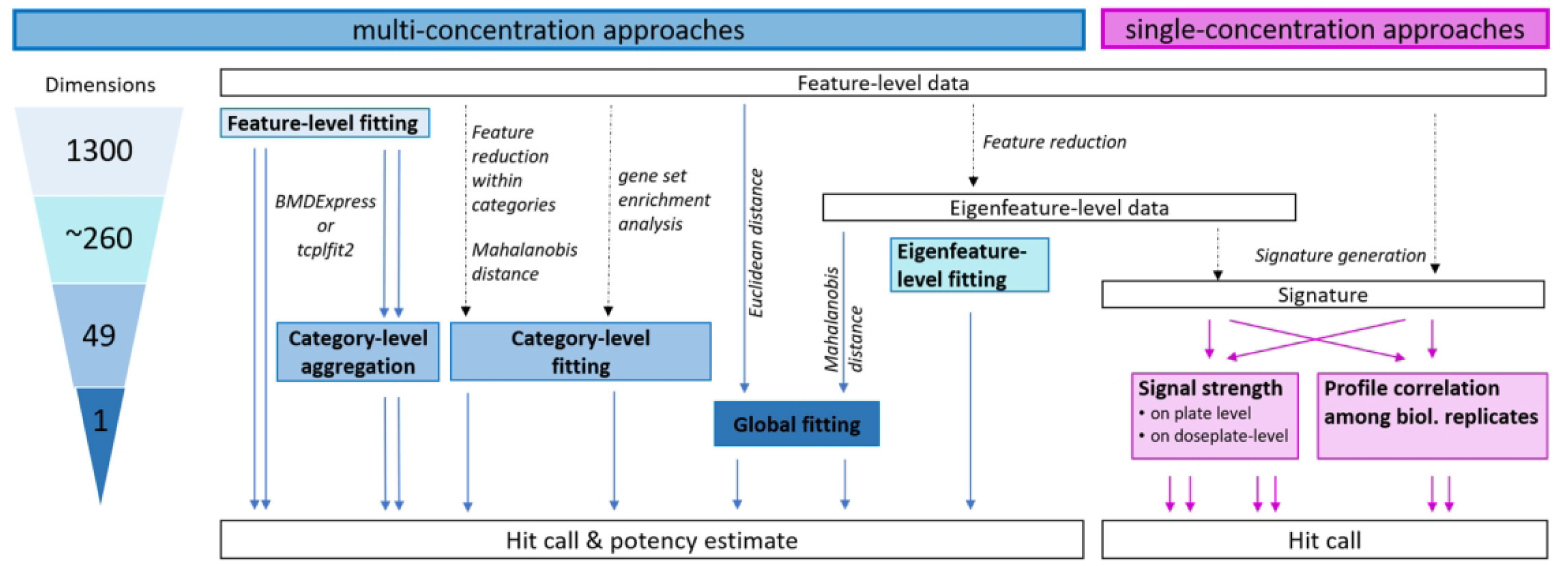
Fig. 1: Approaches for Hit Determination from Imaging-Based Phenotypic Profiling Data.

Multi-concentration approaches for hit determination are shown in blue. Single-concentration approaches for hit determination are shown in pink. The number of individual BMCs that could potentially be derived from each multi-concentration approach are shown in the triangle to the left. The starting point for all approaches was well-level data for each phenotypic feature. Feature-level data can be fit and directly used for potency estimation, or the fit results can be aggregated to the category level (i.e. collection of related features) before determining hit calls and calculating potency estimates. Data from our adaptation of the Cell Painting assay26 can be reduced to 49 categories before curve-fitting using either feature reduction (PCA) or ssGSEA approaches. The 1300 individual features can also be used to calculate a Euclidean distance from controls and model this value as a single response variable. Similarly, feature-level data can be transformed to eigenfeatures to account for correlation among features and then distance from controls can be calculated using the Mahalanobis approach42, 43. Eigenfeature-level data can also be used directly for curve fitting. For single concentration approaches, feature-level or eigenfeature-level data can be used to derive signatures and overall signal strength of the signature can be compared to controls. Alternatively, the correlation of signatures among biological replicates of the same treatment can be used as a hit calling criteria.
