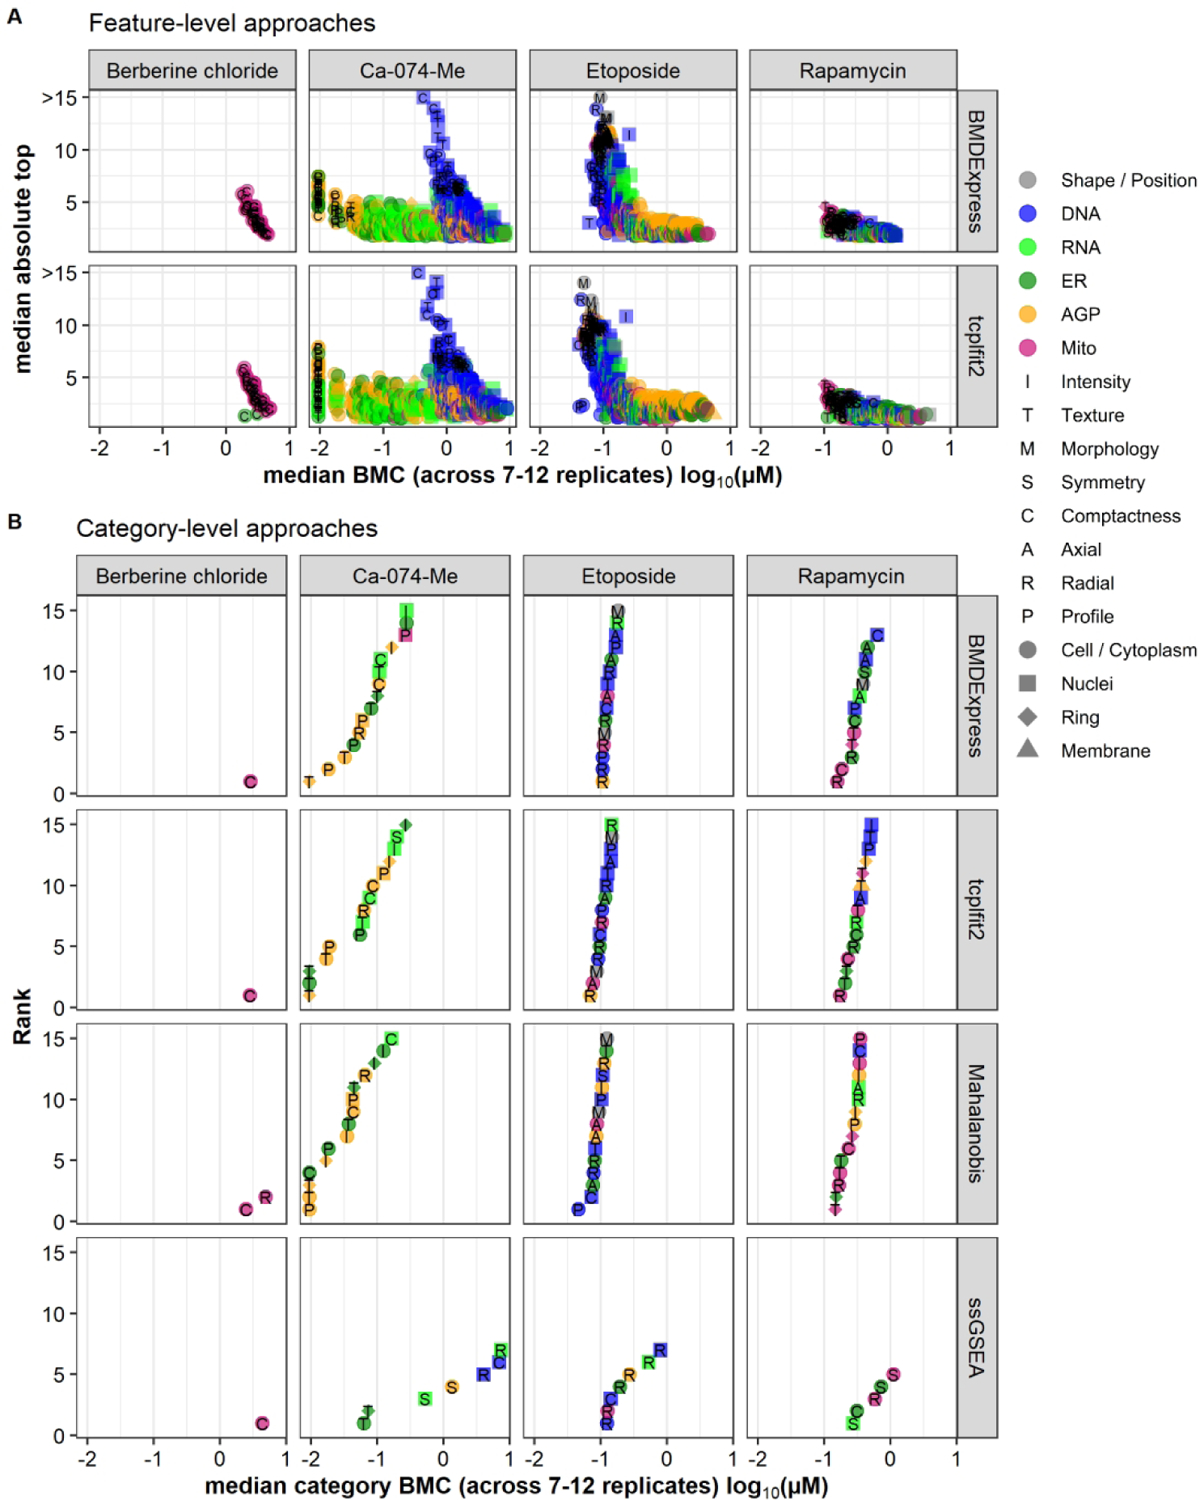
Fig. 5: Comparison of Bioactivity Profiles Across Feature- and Category-Based Approaches.

(A) Potency (x-axis) vs effect size (y-axis) for both feature-level approaches (BMDExpress and tcplfit2). For each reference chemical and feature, the median BMC and the median absolute top of the curve was calculated from the 12 replicates. Features are only displayed if they had a valid BMC in the majority of replicates (i.e. ≥ 7). (B) BMC accumulation plots for all category-based approaches. For each reference chemical and category, the median BMC was calculated from the 12 replicates. Categories that had a valid BMC in the majority of replicates (i.e. ≥ 7) were ranked according to their potencies. Only the 15 most potent categories are displayed. In both (A) and (B), features and categories, respectively, were coded with respect to shape/fluorescent channel (color), feature type (letter) or cellular compartment (shape).
