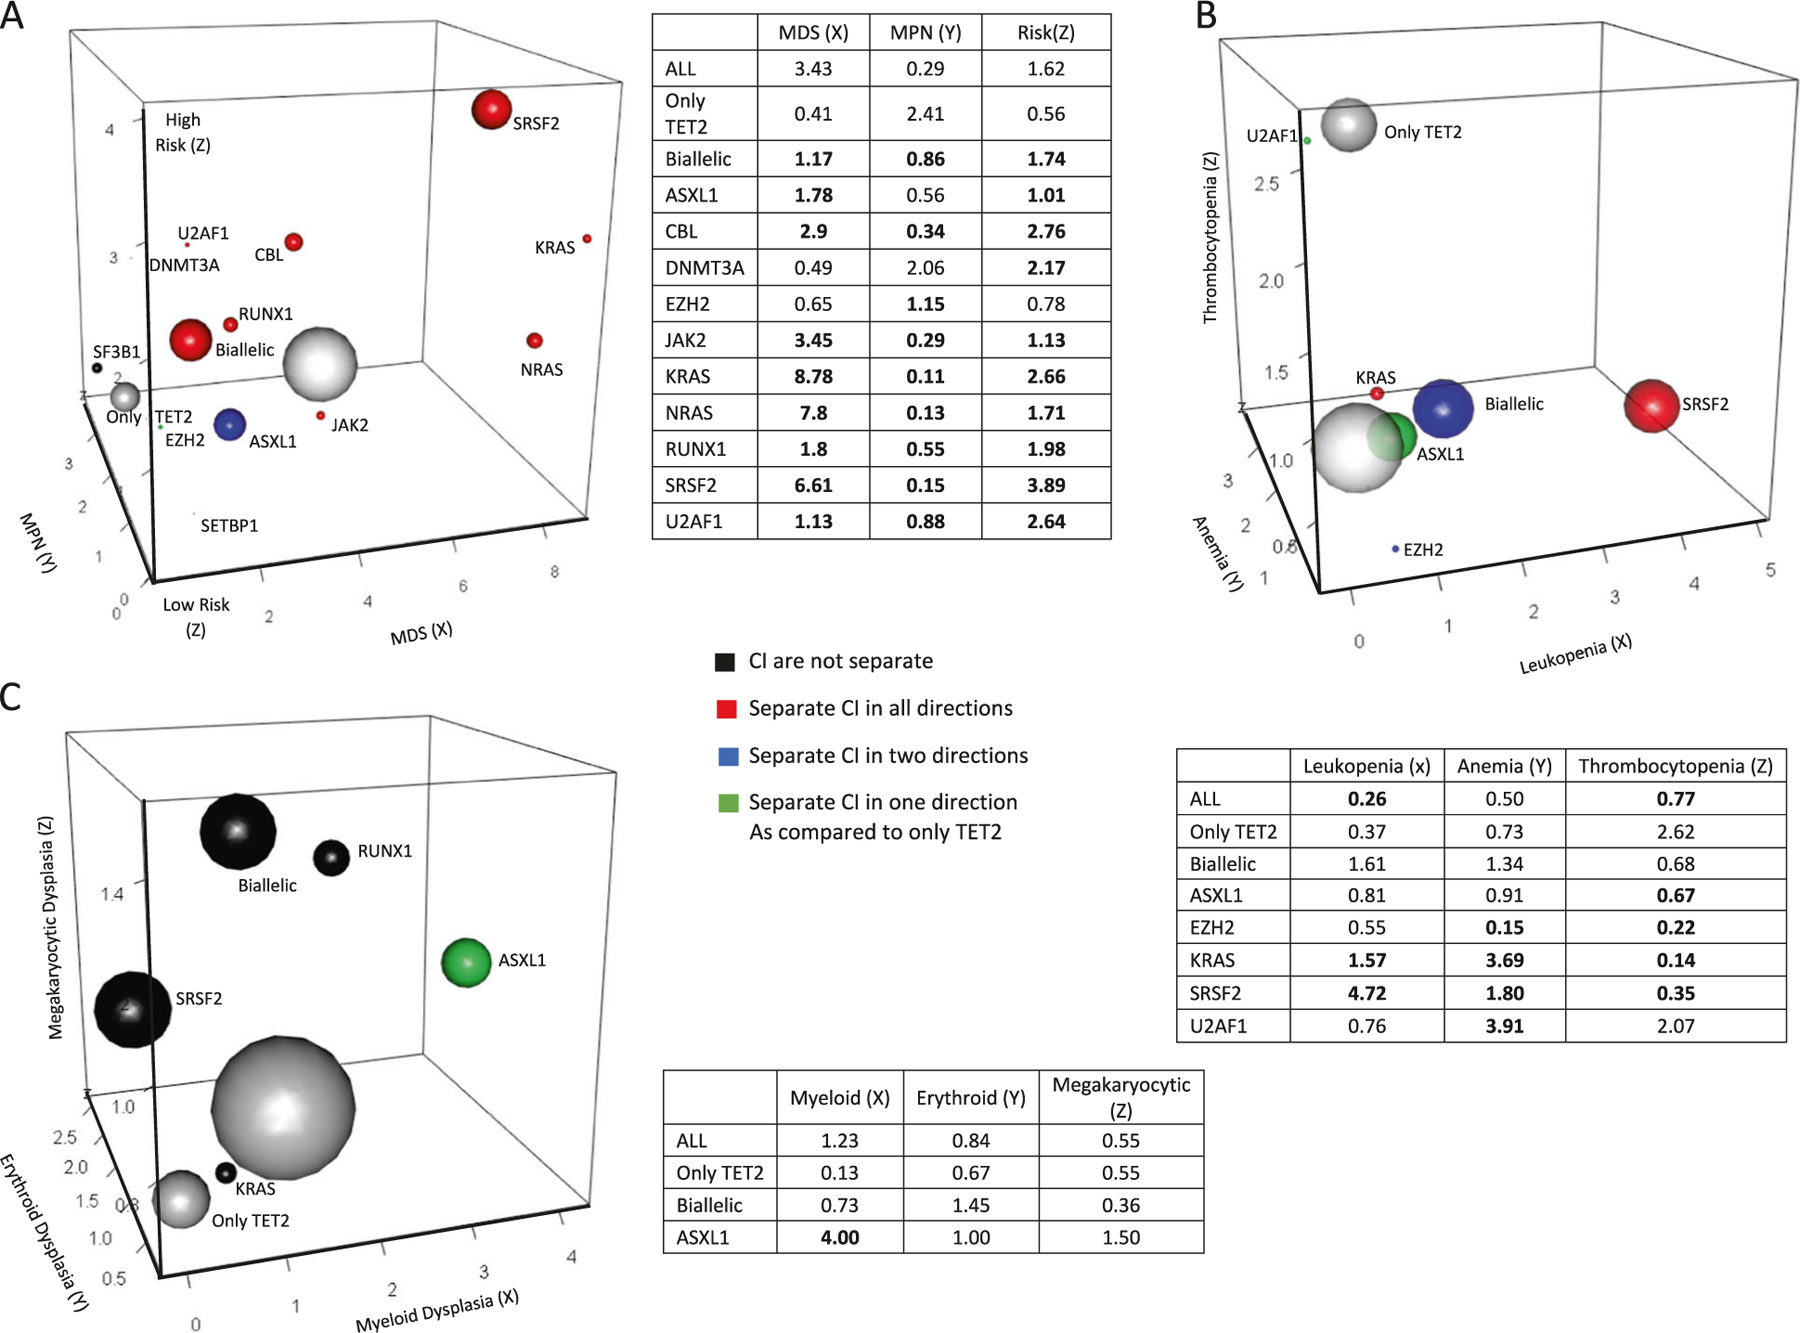
Fig. 4.

Secondary hits of TET2 mutants. a Associations between disease phenotypes and mutation rates are quantified by the odds ratios, MDS (X) vs. MPN (Y), and high risk vs. low risk (Z). Mutations showing significant enrichment in comparison to patients with only a TET2MT (shown in smaller gray ball) are indicated by color according to OR 95% CI limits. Red color indicates separation of CI in all directions, blue indicates separation in two of the three directions, green indicates separation in a single direction, black indicates no separation. The sizes of the spheres are proportional to the frequency of the mutation in our cohort. The largest white ball is the total cohort of all ancestral TET2MT carriers combined. Tables shown provide odds ratio point estimates for each associated plot. b. Associations between phenotypes and mutation rates are quantified by odds ratios, leukopenia (X), anemia (Y), and thrombocytopenia (Z). c. Associations between phenotypes and mutation rates are quantified by odds ratios, myeloid dysplasia (X), erythroid dysplasia (Y), and megakaryoctye dysplasia (Z). Definitions for classification of dysplasia types and cytopenias are provided in Supplementary Table 2
