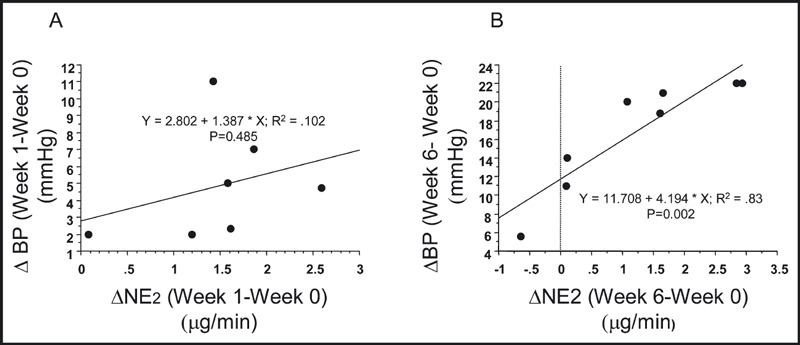
Figure 2.

(A) The regression relationship between the change in NE release into the extravascular compartment (ΔNE2) after 1 week of the high fat diet and the change in mean arterial pressure (ΔBP). The data from the seven animals that had week 1 measurements made are shown. (B) The regression relationship between the change in NE release into the extravascular compartment (ΔNE2) after 6 weeks of the high fat diet and the change in mean arterial pressure (ΔBP). The data from all eight animals that had week six measurements made are shown.
