

Abstract
The authors investigated the relationship between serum phosphate (S‐phosphate) and the metabolic syndrome in a group of middle‐aged hypertensive and normotensive men during 20‐year follow‐up. Fifty‐six men participated. Of the original 34 normotensive men, hypertension developed in 17. In the group as a whole and in those in whom hypertension developed, there was a significant negative relationship between S‐phosphate at baseline and mean blood pressure (MBP) at follow‐up. A significant relationship was observed between S‐phosphate at baseline and components of the metabolic syndrome in the group as a whole, in individuals with hypertension, and in individuals with the lowest S‐phosphate levels at follow‐up. S‐phosphate at baseline predicted MBP 20 years later in a group of hypertensive and normotensive men. When grouped according to the number of components of the metabolic syndrome, individuals with the lowest serum phosphate levels had the highest number of risk factors. These findings may suggest a role of low S‐phosphate in the development of hypertension and the metabolic syndrome.
The metabolic syndrome has become a public health problem of epidemic proportions. Despite recent advances in the understanding of the consequences of the metabolic syndrome, its pathogenesis remains unclear. Haglin 1 presented a hypothesis in 2001 suggesting that low serum phosphate is the cause of the disturbed metabolism in the metabolic syndrome. This was based on the fact that serum phosphate is an important component of energy metabolism. 2 , 3 Reduction of serum phosphate levels could therefore theoretically contribute to the pathogenesis of the syndrome by leading to disturbances in energy metabolism resulting in insulin resistance, hyperglycemia, disturbed lipid metabolism, increased weight, and hypertension. It was suggested for the first time in 1926 that hypophosphatemia might contribute to impaired glucose tolerance. 4 More recently, hypophosphatemia has been linked to impaired glucose utilization, insulin resistance, and hyperinsulinemia 1 , 5 , 6 in patients with the metabolic syndrome; a negative correlation between serum phosphate and body mass index (BMI) has been observed. 1 , 7 , 8 Epinephrine is a hypophosphatemic hormone in humans, 9 and acute epinephrine infusion has been shown to decrease serum phosphate in both hypertensive and normotensive men. 10 Furthermore, several studies including our own have shown decreased serum phosphate in essential hypertension and a relationship between hypophosphatemia and increased sympathetic tone in essential hypertension. 11 , 12
We had the opportunity to follow a group of normotensive and hypertensive middle‐aged Caucasian men for 20 years. Thus, in a prospective study, we aimed to test the hypothesis that there are relationships between serum phosphate levels and the development of elevated blood pressure and components of the metabolic syndrome.
Participants and Methods
Participants in 1984
Seventy‐nine Caucasian men (35 hypertensive and 44 normotensive) were recruited from the Oslo Study at an age of 42.1±0.5 years. The hypertensive group (n=35) consisted of men with untreated, less severe essential hypertension (then classified as grade or stage I and II). They had participated in the Oslo Study, with systolic blood pressure (SBP) levels between 140 and 170 mm Hg and/or diastolic blood pressure (DBP) levels between 90 and 100 mm Hg. They were included in the present study in 1984 if they had a DBP value between 94 and 105 mm Hg. 13 , 14 The normotensive men (n=44) were recruited from the normotensive population of the Oslo Study. They had blood pressure values <140/90 mm Hg. All 79 men had ocular fundi and normal results of electrocardiography, urinalysis, and kidney function testing estimated by creatinine clearance.
Study Protocol in 1984
The study protocol in 1984 has previously been described. 13 , 14 All participants were examined in an outpatient setting by the same physicians. They were studied at the same time of day in a quiet room and at a constant room temperature. All were familiar with clinical examination and blood pressure recording. They fasted and abstained from smoking for 8 hours and from alcohol for 24 hours prior to examination. Blood pressure was recorded semiautomatically (oscillometric technique) with an Omega 1000 adult/pediatric blood pressure monitor (In Vivo Research Laboratories Inc., Tulsa, OK). 13 , 14 The institutional committee of ethics approved the study, and informed consent was obtained from each participant.
Participants in 2004
All 79 participants from 1984 were located, and of these 56 (71%) participated in the 20‐year follow‐up examination. There were 34 of the original 44 normotensive men and 22 of the original 35 hypertensive men. Seven men had died (5 normotensive and 2 hypertensive), 6 men had emigrated or moved to another county (3 normotensive and 3 hypertensive), and 10 men (2 normotensive and 8 hypertensive) either did not respond or responded negatively to a letter of invitation. Those who remained normotensive through the 20‐year follow‐up were defined as sustained normotensive (n=17). At the time of follow‐up, these men had office SBP levels <140 mm Hg and office DBP levels <90 mm Hg or mean 24‐hour ambulatory SBP levels <125 mm Hg and mean 24‐hour ambulatory DBP levels <80 mm Hg. Men defined as normotensive at baseline and who developed hypertension through the follow‐up were defined as new hypertensive (n=17). They had either office SBP ≥140 mm Hg or office DBP ≥90 mm Hg and 24‐hour ambulatory SBP ≥125 mm Hg and 24‐hour ambulatory DBP ≥80 mm Hg or were taking antihypertensive medication (n=5) at the time of follow‐up. The same criteria were used for the sustained hypertensive men (n=22) as for the new hypertensive men. They were hypertensive in 1984 as well as in 2004.
Study Protocol in 2004
The study protocol in 2004 has previously been described. 15 The participants were studied in the same facilities as 20 years ago and at the same time of the day. All were familiar with the clinical examination and blood pressure measurements. They fasted and abstained from smoking for 8 hours and from alcohol for 24 hours prior to the examination. They were all examined by the same physicians who were not aware of their previous blood pressure status. Blood pressure was measured in duplicate with a calibrated mercury sphygmomanometer after 5 minutes’ rest in a sitting position. The arm was supported at heart level, and an appropriately sized cuff was used. The mean of the 2 measurements was used for statistical analyses. Mean blood pressure (MBP) was calculated using the formula: MBP = DBP + (pulse pressure/3). Heart rate was registered after 5 minutes in a sitting position. Height, weight, and waist circumference were measured using standard methods. BMI was calculated from body weight and height (kg/m2). Phosphate levels were measured in our laboratory; the reference values for phosphate in men are 0.75–1.65 mmol/L (2.3–5.0 mg/dL). We assessed insulin sensitivity by using the homeostasis model assessment (HOMA‐R). The HOMA‐R index was calculated using the following formula: serum insulin (pmol/L) × plasma glucose (mmol/L)/135. 16 A high HOMA‐R denotes low insulin sensitivity or insulin resistance. Definition of the components of the metabolic syndrome was based on the International Diabetes Federation criteria with addition of variables thought to increase the risk of cardiovascular disease. The variables were dichotomized. The variables used as risk factors were hypertension at follow‐up (sustained hypertension and new hypertension), waist circumference ≥94 cm (37 in), fasting glucose ≥5.6 mmol/L (100 mg/dL), high‐density lipoprotein (HDL) cholesterol <1.0 mmol/L (40 mg/dL) or specific treatment for this low HDL cholesterol, triglycerides ≥1.7 mmol/L (150 mg/dL) or specific treatment for elevated triglycerides, HOMA‐R index ≥2.8 (median value), uric acid ≥363 μmol/L (6.1 mg/dL) (median value), homocysteine ≥11.6 μmol/L (1.6 mg/L) (median value), and fibrinogen ≥3.2 g/L. At follow‐up, one individual was occasionally using a phosphate‐binding drug (calcium carbonate).
The National Committee of Medical Research Ethics in Norway approved the follow‐up study, and concession was granted from the National Data Inspectorate in Norway. All the participants gave written informed consent.
Biochemical Assays 1984 and 2004
Fasting blood samples were taken as previously described. 13 , 14 , 15 Serum phosphate at baseline was measured on Technicon SMA 12/60 AutoAnalyser (Technicon, Tarrytown, NY) and parathyroid hormone (PTH) by radioimmunoassay. At follow‐up, serum phosphate, fasting glucose, total cholesterol, HDL cholesterol, and triglycerides were measured with a Cobas Integra analyzer (Roche, Basel, Switzerland). The day‐to‐day variation and the biological variation of the phosphate analysis were 9.3% at follow‐up and 10.3% at baseline. Serum insulin was measured using enzyme immunoassay (DAKO Diagnostics Ltd., Cambridgeshire, UK). PTH at follow‐up was measured by an Immulite Intact PTH Assay (Diagnostic Products Corp., Los Angeles, CA). All blood samples were analyzed in a mixed order by technicians who were unaware of the participants’ blood pressure status.
Statistics
SPSS 14.0 (SPSS Inc., Chicago, IL) was used for data management and statistical analysis. Results are presented as mean ± standard deviation unless otherwise stated. Differences are presented as means with 95% confidence intervals. Parametric tests were used for normally distributed data, while log transformations of data or nonparametric tests were applied if data were skewed. Differences between 2 groups were assessed either by Student’s t‐test or with the Mann‐Whitney test, and within‐group differences with either the Student’s t‐test or Wilcoxon test. Comparisons between multiple groups were performed either by one‐way ANOVA or Kruskal‐Wallis ANOVA. Univariate relation between variables were assessed either by the Spearman r correlation coefficient or by the Pearson correlation coefficient and further examined with multiple linear regression analysis using stepwise and enter procedure with assessment of colinear diagnostics. A two‐tailed P value <.05 was considered statistically significant. A regression model was created with serum phosphate levels at baseline as the dependent variable and the count of variables defined as components of the metabolic syndrome as independent variables.
Results
Fifty‐six of the 79 men were accessible for examination 20 years later, as shown in the flowchart (Figure 1). All were Caucasian and of similar age. Characteristics of the men are given in Table I and Table II.
Figure 1.
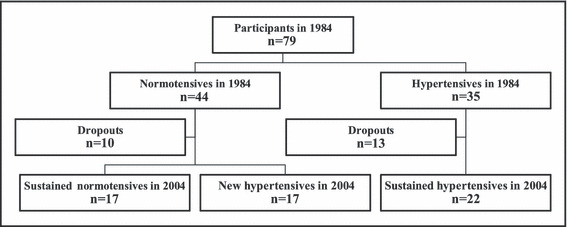
Flowchart of the study groups at baseline in 1984 and at follow‐up in 2004.
Table I.
Characteristics of the Study Population
| Variable | NTNT (n=17) | NTHT (n=17) | HTHT (n=22) | P Value |
|---|---|---|---|---|
| 1984 | ||||
| Age, y | 42.2±0.4 | 42.1±0.4 | 42.1±0.7 | ns |
| Weight, kg | 76.2±7.2 | 78.1±11.5 | 79.2±8.3 | ns |
| BMI, kg/m2 | 24.0±2.2 | 24.3±3.7 | 24.9±2.4 | ns |
| SBP, mm Hg | 117.9±6.2 | 121.8±5.9 | 138.2±8.1 | <.001 |
| DBP, mm Hg | 71.1±6.2 | 74.5±5.2 | 91.2±4.7 | <.001 |
| MBP, mm Hg | 86.7±5.4 | 90.2±4.5 | 106.9±4.8 | <.001 |
| HR, beats/min | 61.7±8.4 | 65.6±7.1 | 74.7±15.8 | <.001 |
| Phosphate, mmol/L | 1.02±0.14 | 0.99±0.11 | 0.86±0.13 | .002 |
| Calcium, mmol/L | 2.18±0.08 | 2.07±0.27 | 2.20±0.08 | .031 |
| PTH, pmol/L | 3.9±0.9 | 3.2±0.7 | 3.3±0.8 | .040 |
| 2004 | ||||
| Age, y | 62.1±0.4 | 62.1±0.4 | 62.5±0.7 | ns |
| Weight, kg | 81.4±8.8 | 84.3±13.1 | 87.7±12.8 | ns |
| BMI, kg/m2 | 26.2±2.8 | 26.9±4.0 | 28.1±3.8 | ns |
| WC, cm | 96.4±7.6 | 98.2±8.5 | 101.2±9.2 | ns |
| SBP, mm Hg | 134.8±11.7 | 149.5±11.4 | 165.2±23.7 | <.001 |
| DBP, mm Hg | 85.8±6.5 | 95.0±8.3 | 102.3±8.2 | <.001 |
| MBP, mm Hg | 102.2±7.0 | 113.1±8.2 | 123.3±12.1 | <.001 |
| HR, beats/min | 64.6±6.9 | 63.9±9.4 | 70.7±10.0 | .037 |
| Phosphate, mmol/L | 1.02±0.16 | 0.96±0.12 | 0.92±0.16 | .11 |
| Calcium, mmol/L | 2.40±0.08 | 2.39±0.07 | 2.39±0.08 | ns |
| PTH, pmol/L | 4.3±1.8 | 4.5±1.3 | 5.0±1.9 | ns |
Abbreviations: BMI, body mass index; DBP, diastolic blood pressure; HR, heart rate; HTHT, sustained hypertension group; MBP, mean blood pressure; NTHT, new hypertension group; NTNT, sustained normotension group; PTH, parathyroid hormone; SBP, systolic blood pressure; WC, waist circumference. To convert phosphate in mmol/L to mg/dL, divide by 0.323; calcium in mmol/L to mg/dL, divide by 0.25.
Table II.
Biochemical Characteristics of the Study Population (2004)
| Variable | NTNT (n=17) | NTHT (n=17) | HTHT (n=22) | Kruskal‐Wallis P Value |
|---|---|---|---|---|
| Glucose, mmol/L | 5.3±0.5 | 6.0±1.8 | 6.2±1.1 | .003 |
| Insulin, pmol/L | 65.6±20.7 | 74.6±57.4 | 92.1±33.0 | .025 |
| Hemoglobin A1c, % | 5.4±0.2 | 5.6±0.6 | 5.5±0.5 | ns |
| HOMA‐R index | 2.6±0.9 | 3.7±3.8 | 4.2±1.7 | .013 |
| Total cholesterol, mmol/L | 5.7±0.8 | 5.1±1.0 | 5.0±0.8 | .036 |
| Triglycerides, mmol/L | 1.0±0.4 | 1.1±0.9 | 1.2±0.5 | ns |
| HDL cholesterol, mmol/L | 1.4±0.4 | 1.3±0.3 | 1.2±0.3 | ns |
| LDL cholesterol, mmol/L | 3.9±0.7 | 3.4±0.8 | 3.4±0.8 | ns |
| Creatinine, μmol/L | 76.7±9.2 | 75.9±12.8 | 81.0±17.3 | ns |
| Uric acid, μmol/L | 363.1±50.1 | 348.3±63.2 | 393.0±70.2 | ns |
| CRP, mg/L | 1.9±1.5 | 1.7±1.5 | 3.1±3.6 | ns |
| Fibrinogen, g/L | 3.3±0.3 | 3.2±0.7 | 3.3±0.5 | ns |
| Homocysteine, μmol/L | 12.2±3.5 | 11.0±2.8 | 15.8±11.7 | ns |
Abbreviations: CRP, C‐reactive protein; HDL, high‐density lipoprotein; HOMA‐R, homeostasis model assessment; HTHT, sustained hypertension group; LDL, low‐density lipoprotein; NTHT, new hypertension group; NTNT, sustained normotension group. To convert glucose in mmol/L to mg/dL, divide by 0.0555; insulin in pmol/L to μIU/mL, divide by 6.945; cholesterol, HDL cholesterol, and LDL cholesterol in mmol/L to mg/dL, divide by 0.0259; uric acid in μmol/L to mg/dL, divide by 59.48; homocysteine in μmol/L to mg/L, divide by 7.397.
Serum Phosphate and Blood Pressure During 20‐year Follow‐Up
Serum phosphate values were significantly lower in the hypertensive group than in the normotensive group in 1984 (0.86±0.13 vs 1.02±0.13 mmol/L, P<.001). This difference between the groups persisted during the 20‐year follow‐up but did not, however, reach significant difference statistically in 2004 (0.92±0.16 vs 0.99±0.14 mmol/L, P=.065). Using the present classification of the men (sustained normotensive, new hypertensive, sustained hypertensive), there were statistically significant differences between the groups in serum phosphate levels at baseline (P=.002), with the highest values in the sustained normotensive group. At follow‐up, there were numerical differences between the groups, with the highest values in the sustained normotensive group; the difference, however, was not statistically significant (P=.11; Table I). Serum calcium and PTH values did not differ between these groups at follow‐up (Table I).
Blood pressure levels increased during the 20‐year follow‐up, and the increase (by definition) was significantly higher in the new hypertensive group than in both the sustained normotensive and sustained hypertensive groups (22.9±8.9 vs 15.5± 6.1 mm Hg; P=.013 and 22.9±8.9 vs 16.4±13.6 mm Hg; P=.044) (Table I).
Relationship Between Serum Phosphate and Blood Pressure
In the group as a whole, there was a significant negative relationship between serum phosphate values in 1984 and MBP 20 years later (r=−0.325; P=.015; n=56; Figure 2). This relationship was also significant in the new hypertensive group (r=−0.496; P=.043; n=17).
Figure 2.
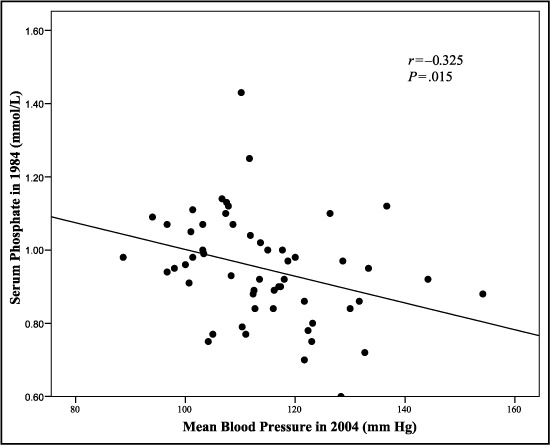
Relationship between serum phosphate levels at baseline and mean blood pressure at 20‐year follow‐up in the combined group of men with normotension and hypertension (n=56).
Multiple regression analysis with MBP in 2004 as a dependent variable and serum phosphate, BMI, heart rate, and MBP in 1984 as independent variables revealed that serum phosphate level at baseline was the only independent predictor of MBP at follow‐up in the new hypertensive group (β=−35.4; P=.043; R 2=0.247). These findings were only observed in individuals whose normotension converted to hypertension and not in the other groups.
Serum Phosphate and Metabolic Variables
BMI increased modestly by 2.1 kg/m2 (25th percentile, 1.3; 75th percentile, 3.6), from 23.8 to 26.2 kg/m2 (n=56), during the follow‐up period. In individuals who were hypertensive at follow‐up (ie, those in both the sustained hypertensive and new hypertensive groups), BMI increased more than in the sustained normotensive group, but this difference was not statistically significant (Table I). There was a numeric difference in waist circumference between the groups at follow‐up, but it also did not reach statistical significance (Table I). No relationships between serum phosphate and the increase in BMI or waist circumference were observed.
There was a significant difference between the groups in glucose, insulin, and HOMA‐R index at follow‐up, with the lowest values in the sustained normotensive group and the highest in the sustained hypertensive group (P=.003 for glucose, P=.025 for insulin, and P=.013 for HOMA‐R index, respectively, Figure 3), while no significant differences were observed for uric acid, lipids, fibrinogen, or homocysteine.
Figure 3.

Difference in homeostasis model assessment (HOMA‐R) index, insulin, and glucose at 20‐year follow‐up. NTNT indicates men with sustained normotension; NTHT, men in whom hypertension developed; HTHT, men with sustained hypertension.
A significant association was observed between serum phosphate at baseline and HDL cholesterol, triglyceride, and homocysteine values at follow‐up in the group as a whole (r=0.332, P=.012; r=−0.292, P=.031; and r=−0.284, P=.034, respectively; n=56). Furthermore, in the men with hypertension at follow‐up (ie, the sustained hypertensive and new hypertensive groups) (n=39), there was a significant association between serum phosphate at baseline and HDL cholesterol (r=0.323, P=.045), triglycerides (r=−0.459, P=.004), and uric acid (r=−0.339, P=.035) at follow‐up (Figure 4).
Figure 4.
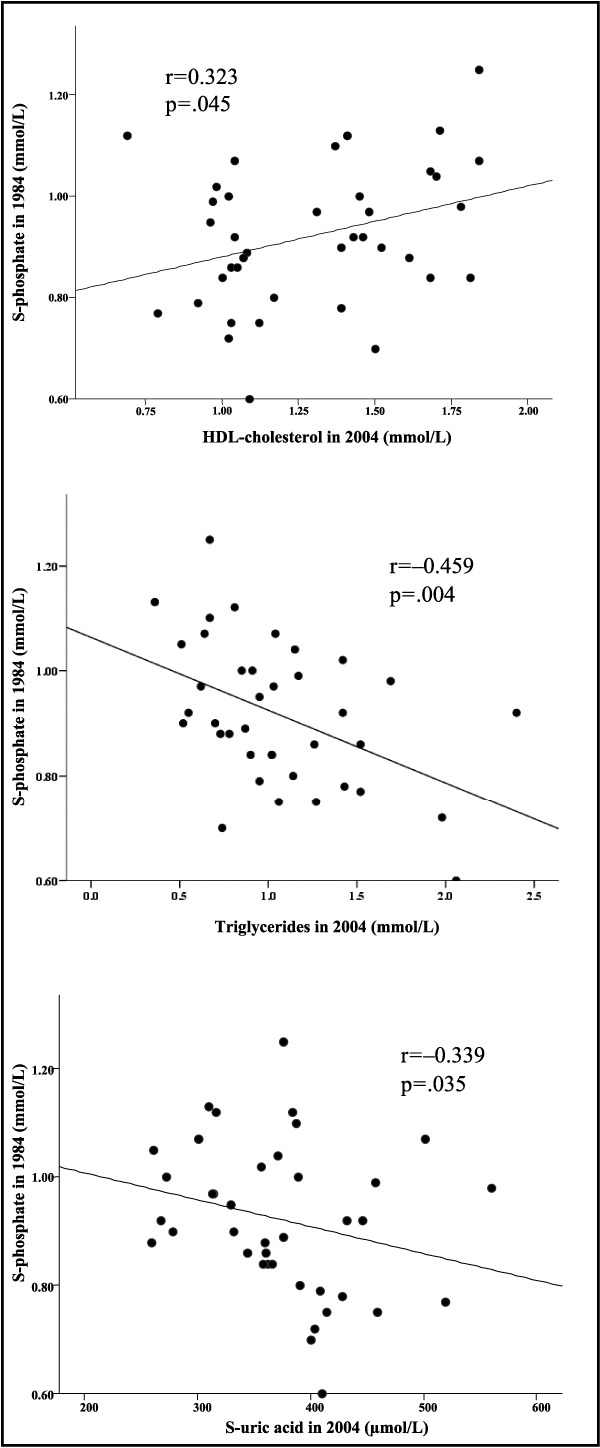
Relationship between serum phosphate at baseline and high‐density lipoprotein cholesterol, triglycerides, and uric acid at 20‐year follow‐up in the combined group of men with sustained hypertension and new hypertension (n=39).
When looking separately at the men with the lowest serum phosphate values at follow‐up (ie, below the median value of 0.97 mmol/l [3.0 mg/dL]), independent of blood pressure status, there was a significant association between serum phosphate level at baseline and the HOMA‐R index (r=−0.503, P=.009) as well as insulin (r=−0.433, P=.027), glucose (r=−0.397, P=.04), HDL cholesterol (r=0.531, P = .004), uric acid (r=−0.430, P=.025), and DBP (r=−0.452, P=.018) at follow‐up.
We classified the distribution of serum phosphate levels according to the number of components of the metabolic syndrome in the participants, both in the whole group and in participants that were hypertensive at follow‐up (sustained hypertensive and new hypertensive groups) (Figure 5A, Figure 5b). There was a linear decrease in serum phosphate levels at baseline, with an increase in the number of components of the metabolic syndrome in the whole group and in the group of hypertensive persons at follow‐up (β=−.027, R 2=.091, P=.024 and β=−.027, R 2=.099, P=.051, respectively).
Figure 5.
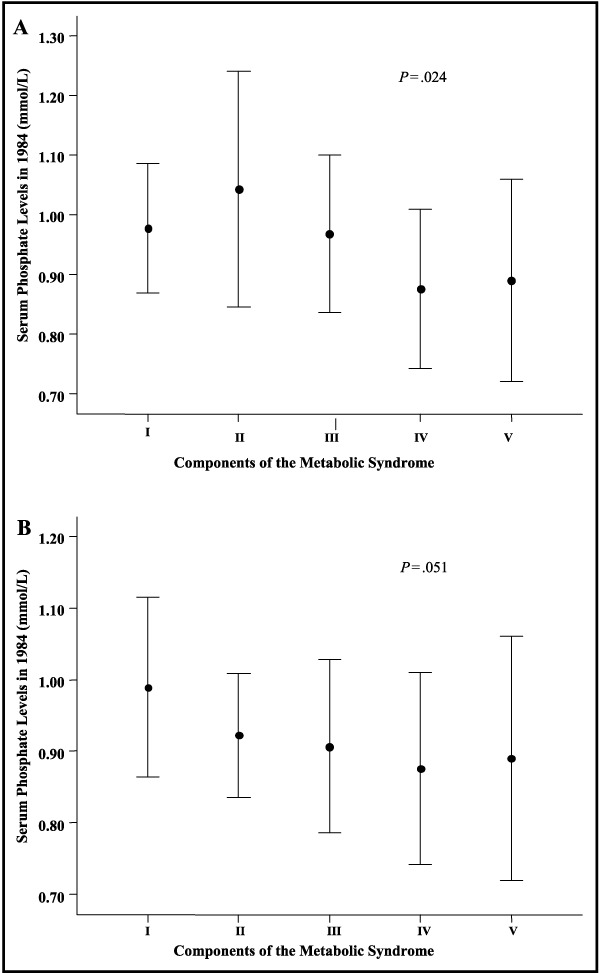
Serum phosphate levels at baseline according to components of the metabolic syndrome at 20‐year follow‐up in the group of men with normotension and hypertension (n=56). I indicates 0–3 components; II, 4 components; III, 5 components; IV, 6 components; V, ≥7 components. Bars represent 1 SD. Panel A: combined group of normotensives and hypertensives (n=56). Panel B: combined group of sustained hypertensives and new hypertensives (n=39).
Discussion
Our data suggest that low serum phosphate levels at baseline are related to levels of blood pressure and predict the development of elevated blood pressure during the 20‐year follow‐up in a combined group of men with normotension and hypertension and in the subgroup in whom hypertension developed (new hypertensive group) during follow‐up. The negative association between serum phosphate levels and blood pressure may partially be explained by the increased sympathoadrenal activity observed in patients with hypertension, since it has been reported that epinephrine leads to a net shift of phosphate from the extracellular to the intracellular compartments. 9 Furthermore, catecholamines stimulate glycolysis, which also increases the intracellular formation of phosphorylated carbohydrate compounds. The source of this phosphate is the inorganic phosphate of the extracellular fluid. As a result, serum phosphate concentrations may decrease. Previously published data from our study population showed a relationship between decreased serum phosphate levels and elevated plasma epinephrine. 11 Our findings therefore support previous cross‐sectional findings; the long follow‐up period made it possible to demonstrate that serum phosphate levels predict blood pressure elevations as well.
An inverse relationship between serum phosphate levels and BMI has been reported earlier. 1 , 7 , 8 In two of these reports 1 , 7 there was a high prevalence of obesity, and in one the authors observed a correlation between BMI and serum phosphate only in women. The difference between their and our study populations might explain why we did not find an association between serum phosphate levels and BMI or waist circumference. Our participants were all lean men and BMI increased only modestly during the follow‐up. In the paper by Haglin 1 from 2001, 77% of the patients had a BMI >27 kg/m2, while in our observation only 18% had a BMI >27 kg/m2 and only 3.6% >30 kg/m2 at baseline.
We observed a significant difference in serum phosphate levels at baseline between the different blood pressure groups; the new hypertension group had values between those in the sustained normotension group and in the sustained hypertension group. Furthermore, a significant difference was observed between the groups in fasting glucose, insulin, and HOMA‐R index, again with the new hypertension group having values between those of the sustained normotension and sustained hypertension groups. A relationship between serum phosphate levels and cardiovascular risk factors in patients with the metabolic syndrome has been described previously. Phosphate is needed for ATP generation and is an important component of carbohydrate metabolism. Reduction in serum phosphate levels could therefore lead to decreased peripheral utilization of glucose, thus leading to the development or exacerbation of insulin resistance. The hypophosphatemic effect of insulin is well recognized, and the following compensatory hyperinsulinemia could affect the phosphate dependent energy metabolism even more, leading to the development of a vicious circle that may contribute to the pathogenesis of the metabolic syndrome. 1 , 5 , 7 , 17
We found a significant association between serum phosphate levels at baseline and components of the metabolic syndrome both in the group as a whole and when looking separately at the men with hypertension at follow‐up and the group with the lowest serum phosphate levels at follow‐up. Our results therefore support findings of others and could support the concept that low phosphate levels play a role in the development of the metabolic syndrome. Furthermore, when we grouped the men according to the number of components of the metabolic syndrome, we found that those with lower serum phosphate levels had the highest number of syndrome components at follow‐up.
Lower serum phosphate levels may be a result of internal redistribution or increased renal clearance. We observed no significant difference between the groups in urinary excretion of phosphate at baseline. That argues against increased renal excretion as an explanation of lower serum phosphate levels in the men with higher blood pressure. PTH is a phosphaturic hormone, enhancing renal excretion of phosphate. Higher PTH levels could therefore lead to lower serum phosphate levels. At baseline, however, the men with the highest serum phosphate values (sustained normotensive group) had the highest PTH levels. Low vitamin D could influence the phosphate levels through its effect on PTH. We did not measure vitamin D in our cohort, but vitamin D deficiency is rare in the Caucasian Norwegian population. 18 Other phosphaturic hormones, especially fibroblast growth factor 23 could play a role in the renal clearance of phosphate in our study population, but this analysis was not available in our laboratory.
In the present study, we were able to reexamine 77.3% of the original normotensive men and 62.8% of the original hypertensive men. Blood pressure at baseline did not differ between those who participated in the follow‐up study and those who did not. It would therefore be fair to assume that selection errors to a large extent were avoided, even though a larger participation of the original hypertensive group would have been preferable. The power of the study is limited by the relatively few participants at both baseline and follow‐up. The strength of the study is the longitudinal study protocol with a follow‐up period of 20 years in addition to the unique homogeneity of the group.
Our data do not clarify whether a low phosphate concentration in persons with the metabolic syndrome is a consequence of the clustering of multiple metabolic abnormalities or is directly implicated in the pathogenesis of the syndrome. They do, however, support previous findings that have suggested that in some way, serum phosphate may play an important role in the pathogenesis of the metabolic syndrome, elevation of blood pressure, and thereby increased cardiovascular risk. The clinical significance of reduced serum phosphate levels and the impact of preventive or therapeutic interventions remain to be elucidated and are the subject of further investigation.
Acknowledgments
Acknowledgments: This work was supported by the Norwegian Renal Association and research fund from the Department of Nephrology, Ullevål University Hospital.
References
- 1. Haglin L. Hypophosphataemia: cause of the disturbed metabolism in the metabolic syndrome. Med Hypotheses. 2001;56:657–663. [DOI] [PubMed] [Google Scholar]
- 2. Massry SG, Fadda GZ, Perna AF, et al. Mechanism of organ dysfunction in phosphate depletion: a critical role for a rise in cytosolic calcium. Miner Electrolyte Metab. 1992;18:133–140. [PubMed] [Google Scholar]
- 3. Thompson CH, Kemp GJ. Reduced muscle cell phosphate (Pi) without hypophosphatemia in mild dietary Pi deprivation. Clin Chem. 1995;41(6, pt 1):946–947. [PubMed] [Google Scholar]
- 4. Friedländer K, Rosenthal WG. Influence of phosphoric acid ion on sugar in blood and in urine of normal and diabetic organisms. Arch Exp Path Pharmacol. 1926; 112:65–81. [Google Scholar]
- 5. Kalaitzidis R, Tsimihodimos V, Bairaktari E, et al. Disturbances of phosphate metabolism: another feature of metabolic syndrome. Am J Kidney Dis. 2005;45:851–858. [DOI] [PubMed] [Google Scholar]
- 6. DeFronzo RA, Lang R. Hypophosphatemia and glucose intolerance: evidence for tissue insensitivity to insulin. N Engl J Med. 1980;22:1259–1263. [DOI] [PubMed] [Google Scholar]
- 7. Haglin L, Lindblad A, Bygren LO. Hypophosphataemia in the metabolic syndrome. Gender differences in body weight and blood glucose. Eur J Clin Nutr. 2001;55:493–498. [DOI] [PubMed] [Google Scholar]
- 8. Lindgarde F, Trell E. Serum inorganic phosphate in middle‐aged men. I. Inverse relation to body weight. Acta Med Scand. 1977;202:307–311. [DOI] [PubMed] [Google Scholar]
- 9. Body JJ, Cryer PE, Offord KP, et al. Epinephrine is a hypophosphatemic hormone in man. Physiological effects of circulating epinephrine on plasma calcium, magnesium, phosphorus, parathyroid hormone, and calcitonin. J Clin Invest. 1983;71:572–578. [DOI] [PMC free article] [PubMed] [Google Scholar]
- 10. Kjeldsen SE, Moan A, Petrin J, et al. Effects of increased arterial epinephrine on insulin, glucose and phosphate. Blood Press. 1996;5:27–31. [DOI] [PubMed] [Google Scholar]
- 11. Kjeldsen SE, Os I, Westheim A, et al. Decreased serum phosphate in essential hypertension. Related to increased sympathetic tone. Am J Hypertens. 1988;1:403–409. [DOI] [PubMed] [Google Scholar]
- 12. Ljunghall S, Hedstrand H. Serum phosphate inversely related to blood pressure. Br Med J. 1977;1:553–554. [DOI] [PMC free article] [PubMed] [Google Scholar]
- 13. Os I, Kjeldsen SE, Westheim A, et al. Endocrine and haemodynamic responses to graded dopamine infusion in essential hypertension. Scand J Clin Lab Invest. 1987; 47:371–377. [PubMed] [Google Scholar]
- 14. Os I, Kjeldsen SE, Westheim A, et al. Decreased central dopaminergic activity in essential hypertension. J Hypertens. 1987;5:191–197. [DOI] [PubMed] [Google Scholar]
- 15. Gudmundsdottir H, Strand AH, Høieggen A, et al. Do screening blood pressure and plasma catecholamines predict development of hypertension? Twenty‐year follow‐up of middle‐aged men. Blood Press. 2008;17:94–103. [DOI] [PubMed] [Google Scholar]
- 16. Matthews DR, Hosker JP, Rudenski AS, et al. Homeostasis model assessment: insulin resistance and beta‐cell function from fasting plasma glucose and insulin concentrations in man. Diabetologia. 1985;28:412–419. [DOI] [PubMed] [Google Scholar]
- 17. DeFronzo RA, Lang R. Hypophosphatemia and glucose intolerance: evidence for tissue insensitivity to insulin. N Engl J Med. 1980;303:1259–1263. [DOI] [PubMed] [Google Scholar]
- 18. Alver K, Meyer HE, Falch JA, et al. Bone mineral density in ethnic Norwegians and Pakistani immigrants living in Oslo–The Oslo Health Study. Osteoporos Int. 2005; 16:623–630. [DOI] [PubMed] [Google Scholar]