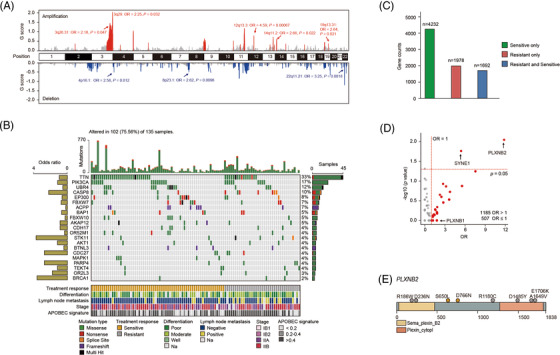
FIGURE 2.

Somatic mutational landscape and clinical drug‐resistant genes. (A) Significant CNV events detected in high‐purity samples (n = 89). Amplifications and deletions related to treatment response are labelled. (B) Somatic mutational landscape of 21 significant driver genes detected with MutSigCV or oncodriveCLUST algorithms sorted by their mutation frequencies. Nonsynonymous mutation counts are shown above. Treatment response, differentiation level, lymph node metastasis state, cancer stage, and APOBEC signature contribution are annotated below. Left bar chart: the odds ratio for drug resistance. Right bar chart: number of samples with mutations. (C) The counts of the genes mutated only in drug‐sensitive patients’ group, drug‐resistant patients’ group, and both groups; 1978 genes mutated only in drug‐resistant patients’ group were directly included in clinical candidate drug‐resistant gene set. (D) Treatment response odds ratio (OR) and Fisher's exact test significance for genes mutated both in drug‐sensitive and drug‐resistant patients’ groups. Total 1185 genes with an OR > 1 are coloured red and included in the clinical candidate drug‐resistant gene set. Critical genes PLXNB1, PLXNB2 and SYNE1 were labelled. (E) Functional domains and somatic mutation positions schematics for treatment response‐related gene PLXNB2. The grey dot represents the mutation in the drug‐resistant patients’ group, and the orange dot represents the mutation in the drug‐sensitive patients’ group. Numbers refer to amino acid residues and domains are depicted with various colours and annotations below. Two sensitive mutations in PLXNB2 were detected from one patient
