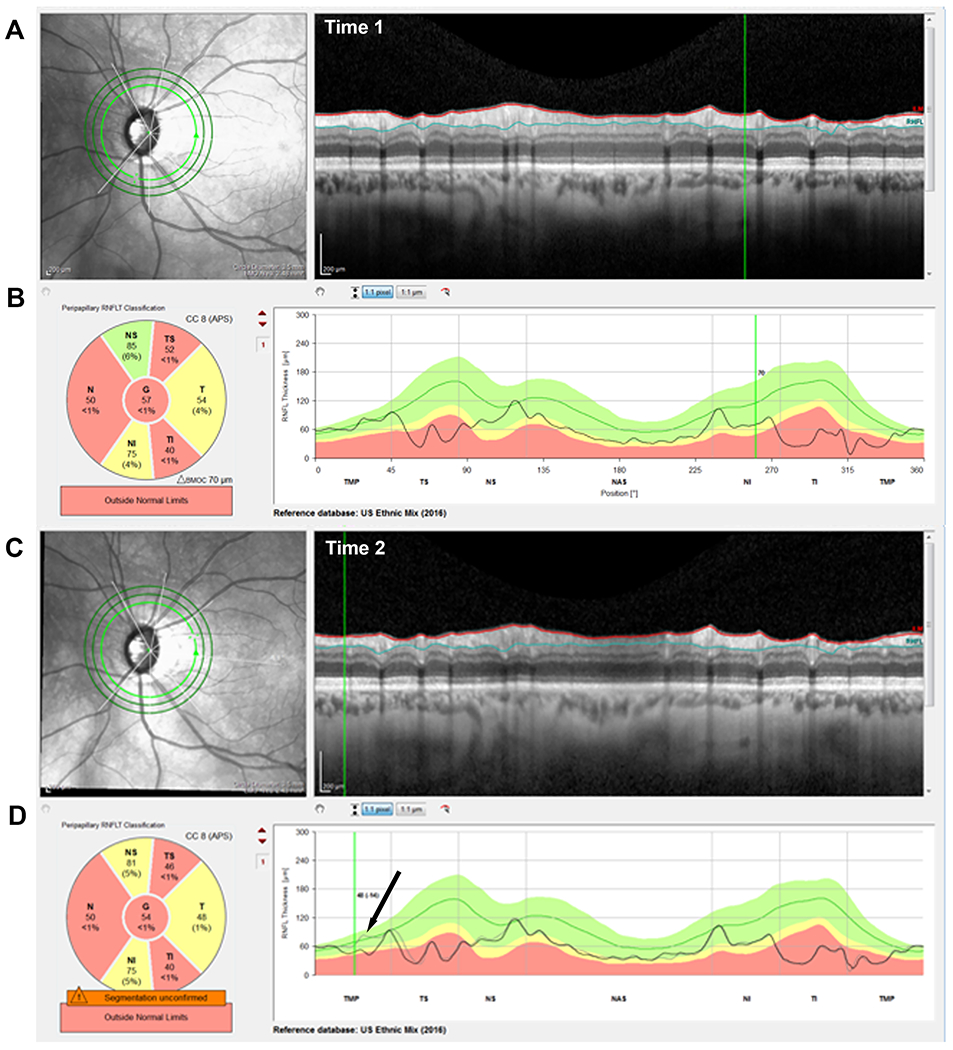
Figure 1.

An example of a progressing eye. (A & C) The IR images and circle b-scans for time 1 & 2, respectively. (B & D) The cRNFL thickness profiles/curves for time 1 & 2, respectively. The black arrow in panel D indicates the region of progression, as shown by the difference between the gray (time 1) and black (time 2) curves and confirmed in the corresponding b-scans A & C.
