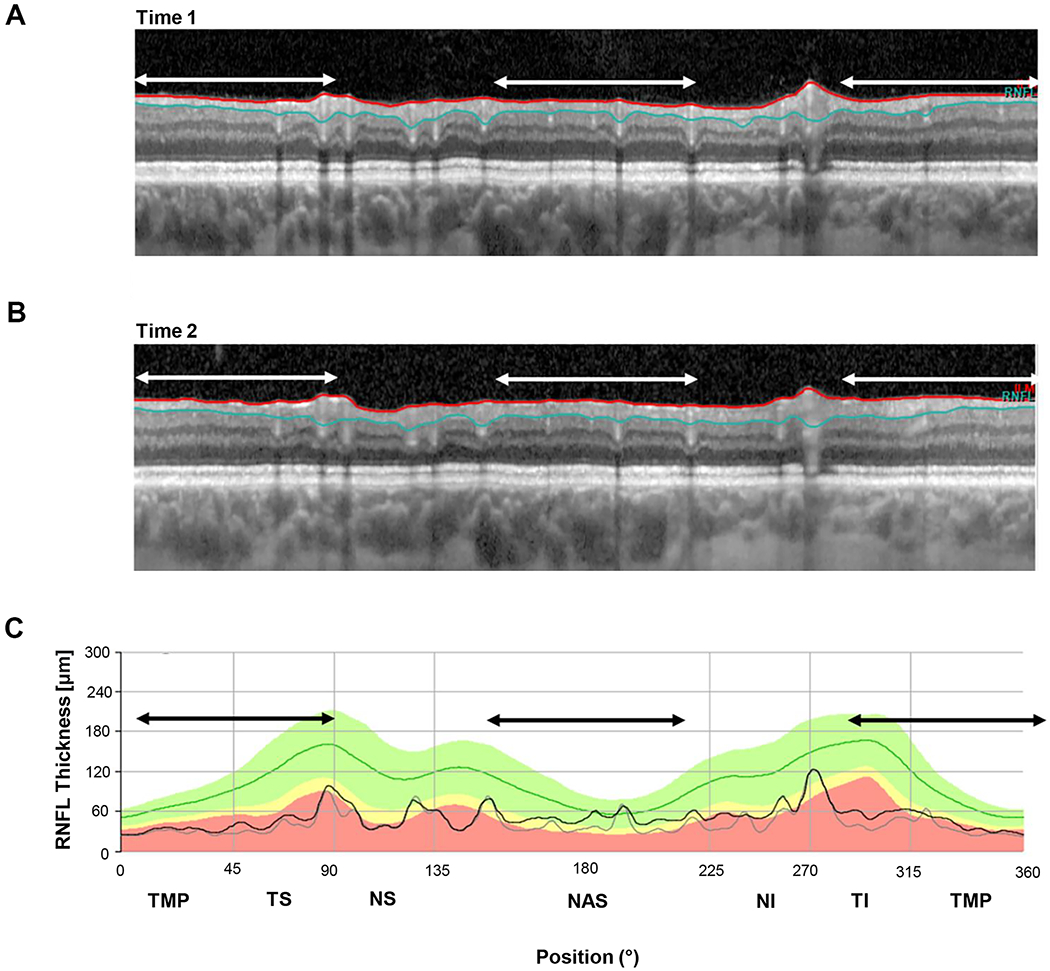
Figure 7.

An example of segmentation errors. (A) The b-scan for time 1. (B) The b-scan for time 2. C. The cRNFL thickness profiles for the first (gray) and second (black) times. The black and white arrows indicate regions where there are segmentation errors. In this example, the algorithm located the RNFL/GCL border consistently lower on time 2. (Eye ID a)
