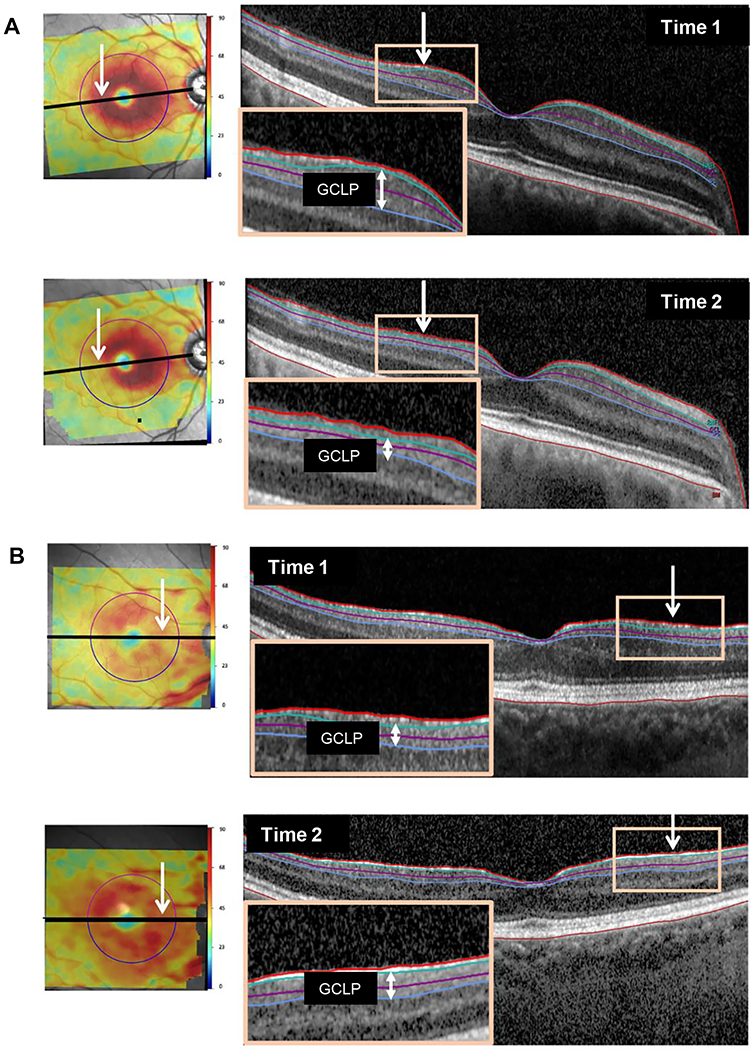
Figure 8.

(A) An example of progression: macular thickness maps (left panels) for both times along with b-scans (right panels) through the fovea. Insets highlight thinning of the GCLP (vertical white arrows). (Eye ID 7). (B) An example of segmentation errors: same as panel A but with insets highlighting the segmentation errors. (Eye ID g)
