. 2021 Nov 15;23(12):1893–1905. doi: 10.1039/d1em00329a

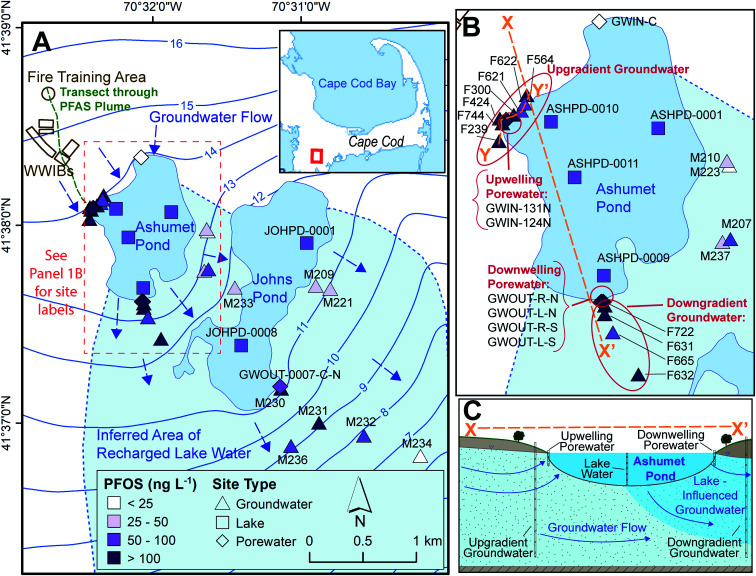
Fig. 1. Study sampling locations. (A) Map of locations sampled between 2016 and 2019. WWIBs denotes wastewater infiltration beds. Most sampling locations include multiple sampling depths. Blue arrows indicate groundwater flow directions. Contours show elevation of water table in m above sea level, referenced to the National Geodetic Vertical Datum of 1929 (NGVD 29).38 The plume of per- and polyfluoroalkyl substances (PFAS)6 primarily discharges to Ashumet Pond near the westernmost extent of the lake. The maximum aqueous perfluorooctane sulfonate (PFOS) concentration is shown for each location.41 The locator map is from the U. S. Geological Survey National Hydrography Dataset, data refreshed April 2019.66 (B) Enlarged view of Ashumet Pond and associated sampling sites. (C) Cross-sectional representation of Ashumet Pond (not to scale) along section line X–X′ depicted in (B).

Fig. 1