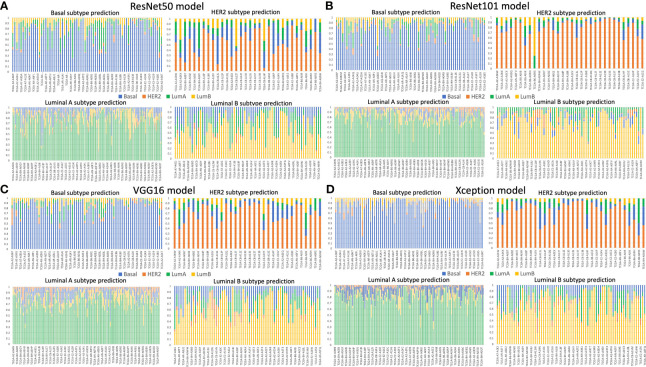
Figure 4.
Slide-wise subtype prediction using the testing set. (A) ResNet50 model, (B) ResNet101 model, (C) VGG16 model, (D) Xception model. Basal, HER2, luminal A, and luminal B subtypes are represented in blue, orange, green, and yellow bars, respectively. A threshold of 0.5 was used to select the correct prediction subtype from the whole slide image of each patient. The prediction probability of each subtype was aggregated from the patches of the same patient.

