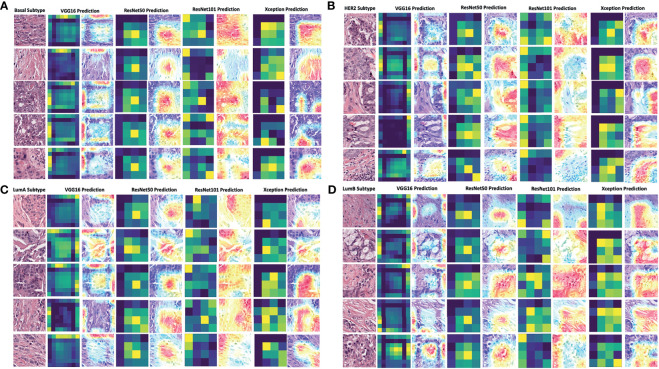
Figure 5.
Grad-CAM visualization of deep learning models in four breast cancer subtypes. The visualization of each model’s prediction for the same set of images from five patients with breast cancer of the basal subtype (A), HER2 subtype (B), luminal A subtype (C), and luminal B subtype (D). The heatmap in dark green and yellow colors was plotted together with the merged images of the original and activated heatmaps. The activation levels in the merged images are shown with a gradient of red, yellow, and blue areas, which the models used to make a classification decision. LumA: Luminal A; LumB: Luminal B.

