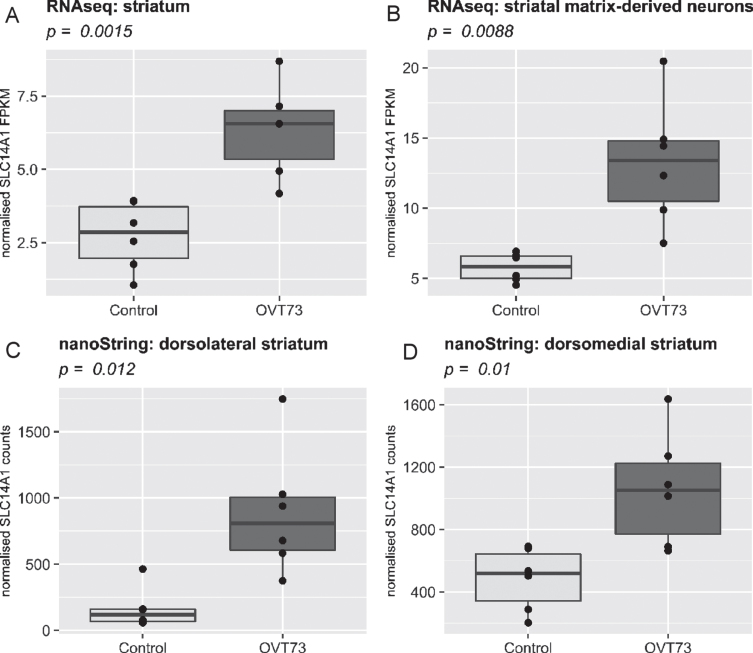
Fig. 2.
Comparison of SLC14A1 expression in four different transcriptomic datasets within the multi-omic HD sheep platform. SLC14A1 is significantly upregulated (p < 0.05, two tailed T-test) in the OVT73 brain (n = 6) relative to control animals (n = 6). A) Ref. data 1: An RNA-Seq analysis conducted on striatum samples, B) Ref. data 3: An RNA-Seq analysis conducted on striatal matrix-derived neurons preferentially captured via laser-captured microdissection. C, D) Ref. data 2: nanoString quantification of 24 genes conducted on samples taken from dorsolateral (C) and dorsomedial (D) striatum. In all graphs the x-axis displays the transgenic status of the sheep (Control or OVT73) and the y-axis displays normalised SLC14A1 levels (FPKM for RNA-Seq data and normalised counts for nanoString data). Direct visual comparison of datasets as shown was performed using the ggplot2 package in R.

