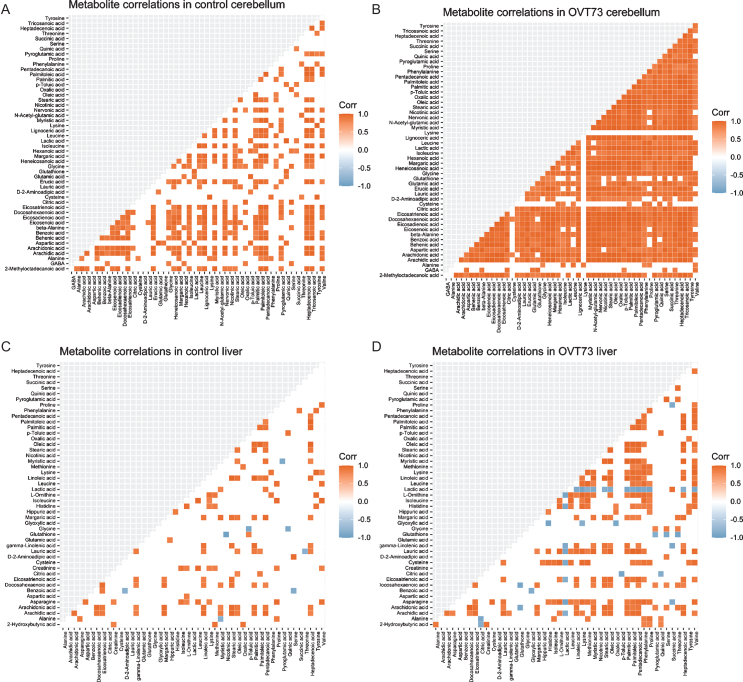
Fig. 3.
OVT73 have more significant metabolite-metabolite correlations than controls. The ggcorrplot() function in R was applied to GC-MS metabolomics dataset (Ref. data 4), producing correlation coefficients, p-values and visual plots, as shown, for every variable-variable pair, with comparison of OVT73 and control groups. Significantly positively correlated metabolites are displayed as red squares and significantly negatively correlated metabolites are displayed as blue squares (p < 0.05) according to the figure legend. As shown by the number of coloured squares, there were more significantly correlated metabolite-metabolite pairs in the OVT73 cerebellum (B) and liver (D) compared to their respective control plots; control cerebellum (A) and control liver (C).

