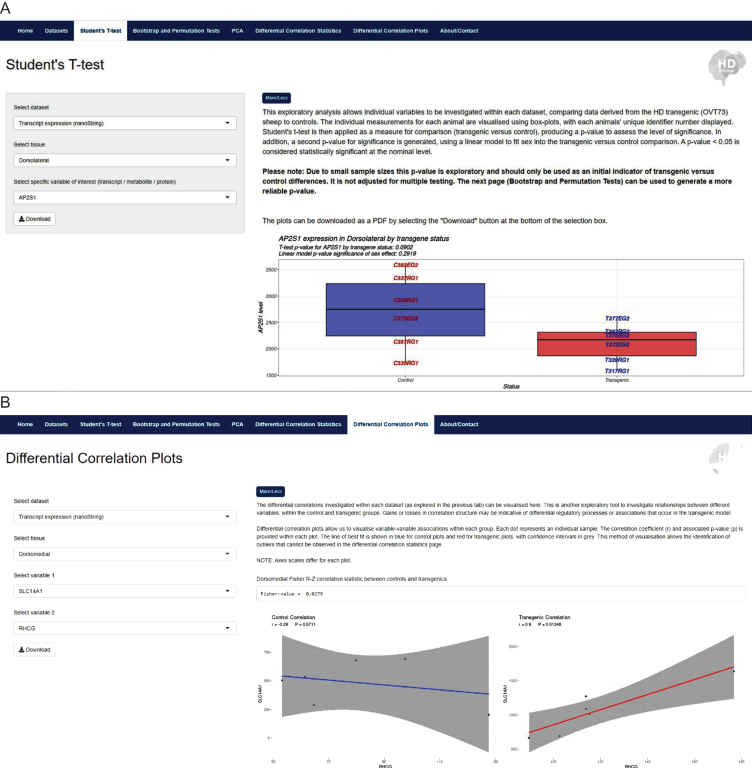
Fig. 4.
The HD sheep database https://hdsheep.cer.auckland.ac.nz/. Examples of two analyses tabs within the HD sheep database: A) Student’s T-test and B) Differential correlation plots. These analyses can be used to investigate data in a query-based manner, comparing OVT73 sheep to controls, with variable selection. Results are displayed as informative graphical outputs for interpretation by the researcher. A shows a significant difference in OVT73 vs. control SLC14A1 expression in the dorsomedial striatal tissue (p < 0.007). B shows differential correlation structures in OVT73 vs. control for SLC14A1 and RHCG transcript expression in dorsomedial striatal tissue.

