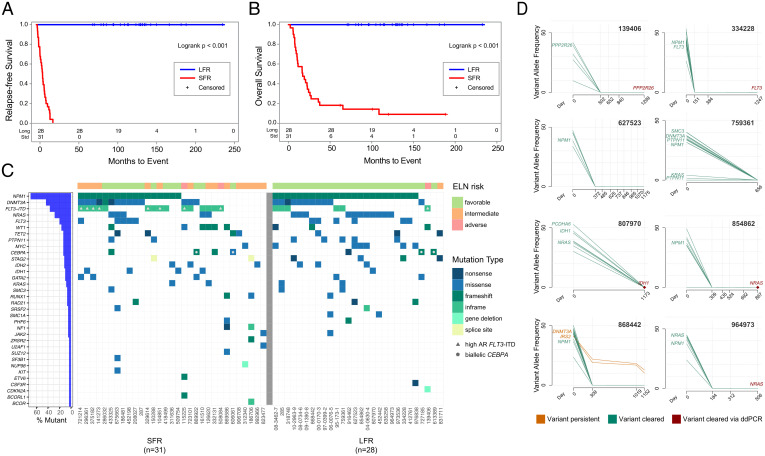
Fig. 1.
Clinical and genomic features of AML patients at presentation and in remission. (A) RFS and (B) OS curves for NK-AML patients who were treated with chemotherapy only for induction and consolidation. The blue line represents the LFR cases (n = 28) and the red line the SFR cases (n = 31). (C) The mutational landscape and the ELN classification for each case. Each column represents a patient, and each row represents a gene that is mutated in at least one of these cases. Every case had one or more recognized AML driver mutations, with a median of 11 (range 1 to 37) protein-altering somatic mutations per case in the Washington University in St. Louis samples. Color indicates the type of mutation, as specified in the legend. Cases with a high FLT3-ITD allelic ratio are indicated by the gray triangle in the figure. Blue bars at left indicate the mutation frequency in the sample set. (D) Clearance plots displaying the variant allele frequencies (VAFs) of recurrently mutated AML genes, plotted at presentation (day 0) and at available time points during clinically defined remissions (days), assessed with error-corrected sequencing. The average coverage of all variants for the remission samples was 3,042×, with a range of 161 to 13,266×. Every sample had at least one AML-specific mutation assayed with a coverage depth greater than 5,000×, yielding a sensitivity of 1 AML cell in ∼2,500 (0.04%). In the remission samples, seven of eight patients demonstrated clearance of all mutations in all samples tested. In one case (868442), a persistent ancestral clone was detected in all remission samples, harboring a DNMT3AR882H (VAF 10.19% at day 1,152) and an IRS2D106Y mutation (VAF 12.82% at day 1,152). Mutation clearance of the genes highlighted in red was confirmed with digital droplet PCR, at a sensitivity of 1 AML per 100,000 cells tested (SI Appendix, Fig. S2).

