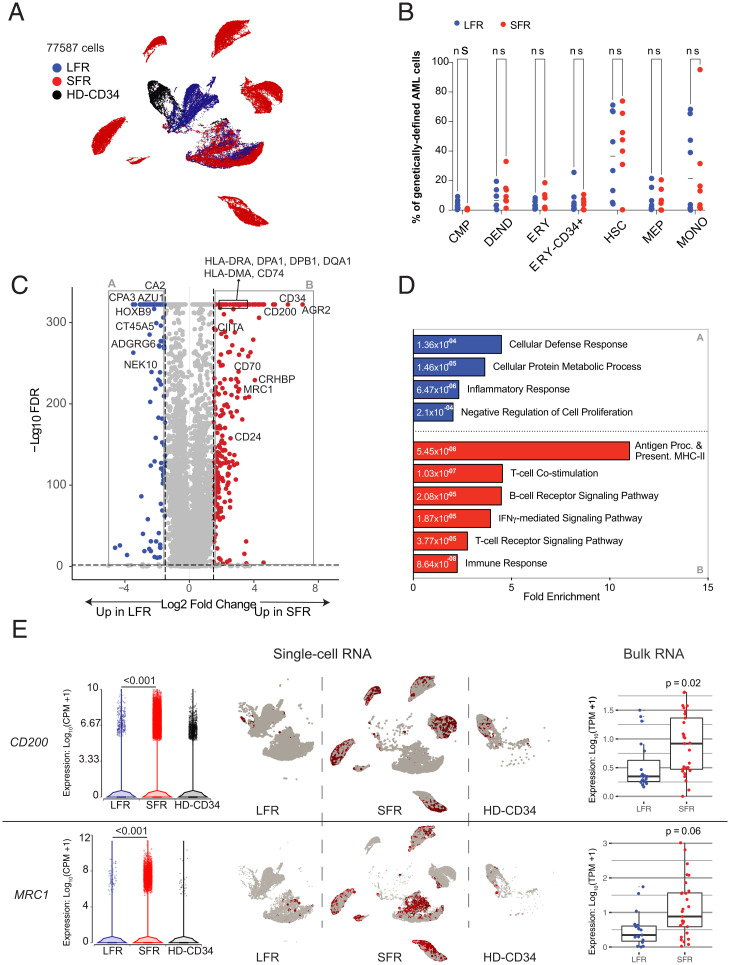
Fig. 2.
RNA-seq studies of LFR and SFR AML samples. (A) UMAP projection of 77,587 genetically defined AML cells from 8 LFR and 7 SFR samples at presentation, and purified CD34+ cells from the BM samples of 2 healthy donors (HD-CD34). Colors reflect the sample groups, as indicated in the legend. Cells were identified as AML by requiring expression of a AML-specific somatic mutation in that cell; relevant mutations were defined for each sample by exome sequencing. (B) Proportion of the genetically defined AML cells composed of different cell types across each AML sample for LFR cases (blue) vs. SFR cases (red). Horizontal lines indicate median values. (C) DEGs in genetically defined AML cells from the presentation BM samples of SFR vs. LFR patients. Dashed lines indicate log2 FC of ±2 and FDR < 0.001. Red points represent genes with significantly higher expression in the SFR cases, and blue points represent genes that are more highly expressed in the LFR cases. (D) Enrichment for gene ontology terms in the DEGs. Blue and red bars are pathways enriched in the LFR or SFR cases, respectively; numeric values indicate FDR. (E, Left) Expression of CD200, and MRC1 in single-cell data, with each point representing a cell. (Center) UMAP plots (split by category) showing single-cell expression of the corresponding gene. (Right) Expression from bulk RNA-seq datasets with additional AML samples (LFR, blue dots, n = 19; SFR, red dots, n = 31).

