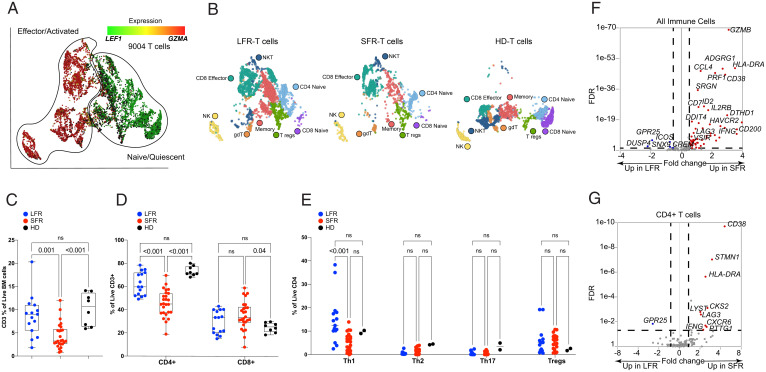
Fig. 3.
scRNA-seq and flow cytometric studies of T cells from LFR vs. SFR cases. (A and B) UMAP projections of 9,004 T cells from the total BM samples of 2 healthy donors and the 15 AML patients described in Fig. 2. (A) T cells are colored by the relative expression of LEF1, representing naïve or quiescent cells (green), vs. GZMA, representing activated or effector cells (red). (B) T cell subsets are labeled by subtypes, identified by applying graph-based clustering, then identifying enriched biomarkers for each cluster. (C–E) Boxplots displaying flow cytometric data from BM samples from healthy donors (HD) or LFR vs. SFR cases, for (C) percentages of CD3+ cells, (D) percentages of CD4+ and CD8+ cells, and (E) percentages of Th1, Th2, Th17, and Treg subsets. Means were analyzed for significance with two-way ANOVA and Tukey correction for multiple comparisons. (F and G) The results of an ANOVA comparison of 142 previously described activation/exhaustion markers (32, 33) in all 9,004 T cells (F) and in CD4+ T cells (G), comparing SFR to LFR cases. The x axis shows the log FC for each gene, with no change (N/C) as the midpoint. The y axis shows FDR in descending values. DEGs (defined by log FC ± 1.3, FDR < 0.05) are highlighted in red for SFR cases, or blue for LFRs.

