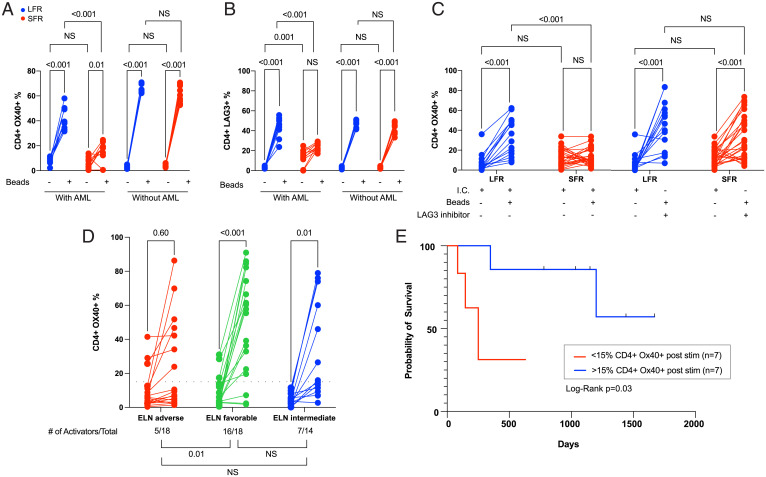
Fig. 4.
CD4+ T cell activation studies from the BM samples of AML cases at presentation. For the data shown in A–C, cryovials from presentation BM AML samples from LFR vs. SFR cases were thawed, and the fraction of CD3+ T cells was immediately defined by flow cytometry. These unfractionated samples were placed in media containing human SCF, IL-3, FLT3L, TPO, and IL-2 (10 ng/mL), and also CD3/CD28 T cell receptor agonist beads in a 1:1 ratio with the previously defined number of T cells (“with AML”). An identical experiment was performed using BM-derived CD3+ T cells enriched from the same samples (“without AML”); CD3/CD28 beads were added at a 1:1 ratio after a 24 h “washout” period. T cell activation and inhibition markers were then quantified by flow cytometry 5 d later in both sets of experiments. The lines show the change in percentage of CD4+ cells expressing the activation marker OX40 (A) vs. the inhibitory marker LAG3 (B) in samples treated with or without CD3/CD28 beads, which activate via the T cell receptor (as indicated by the legend below each graph). Red lines represent the SFR samples and blue lines represent LFR samples. Two-way ANOVA and Tukey multiple comparison tests were used to test for significance differences between groups. Results represent the summary of three independent experiments (n = 10 unique samples from both the LFR and SFR sets). (C) Similar levels of activation (as defined by OX40 expression) can be achieved in CD4+ T cells from SFR samples in the presence of a LAG3 blocking antibody at day 5 poststimulation. The negative controls (I.C. = isotype control) were treated with an isotype matched antibody. Two-way ANOVA and Tukey multiple comparison tests were used to test for significance differences between groups (n = 15 for LFR and n = 26 for SFR cases). (D) Changes in T cell activation, measured by the percentage of CD4+ cells expressing OX40, in 50 novel AML cases from an extension set. Unfractionated BM samples from the presentation samples were evaluated 5 d after activation with CD3/CD28 T cell receptor agonist beads (in a 1:1 ratio with the number of measured T cells in each sample). The AML samples are grouped according to ELN category. Two-tailed t tests were used to calculate significance between pre- and postactivation samples. The threshold for CD4+ cell activation was defined as the median difference in activation (poststimulation over baseline) for the 50 samples tested with this assay (indicated by the black dotted line, at y = 15%). The number of AML samples that exhibited T cell activation in each ELN risk category, and a statistical comparison of the three groups, are shown below the graphs. Pearson’s χ2 test with Yates’ continuity correction was used to calculate differences in T cell activators among the groups. (E) The RFS for the intermediate ELN risk cases from the extension set (D) stratified by CD4+ cell activation status. The blue and red lines represent samples with CD4+ cell activation above and below the activation threshold (defined as >15% CD4+ OX40+ cells, and an FC from baseline CD4+ OX40 expression ≥2.0). Vertical black lines indicate subjects at the time of censoring, as further defined in Methods. Log-rank (Mantel–Cox) test was used to estimate the difference in RFS (P = 0.03).

