
Fig. 3.
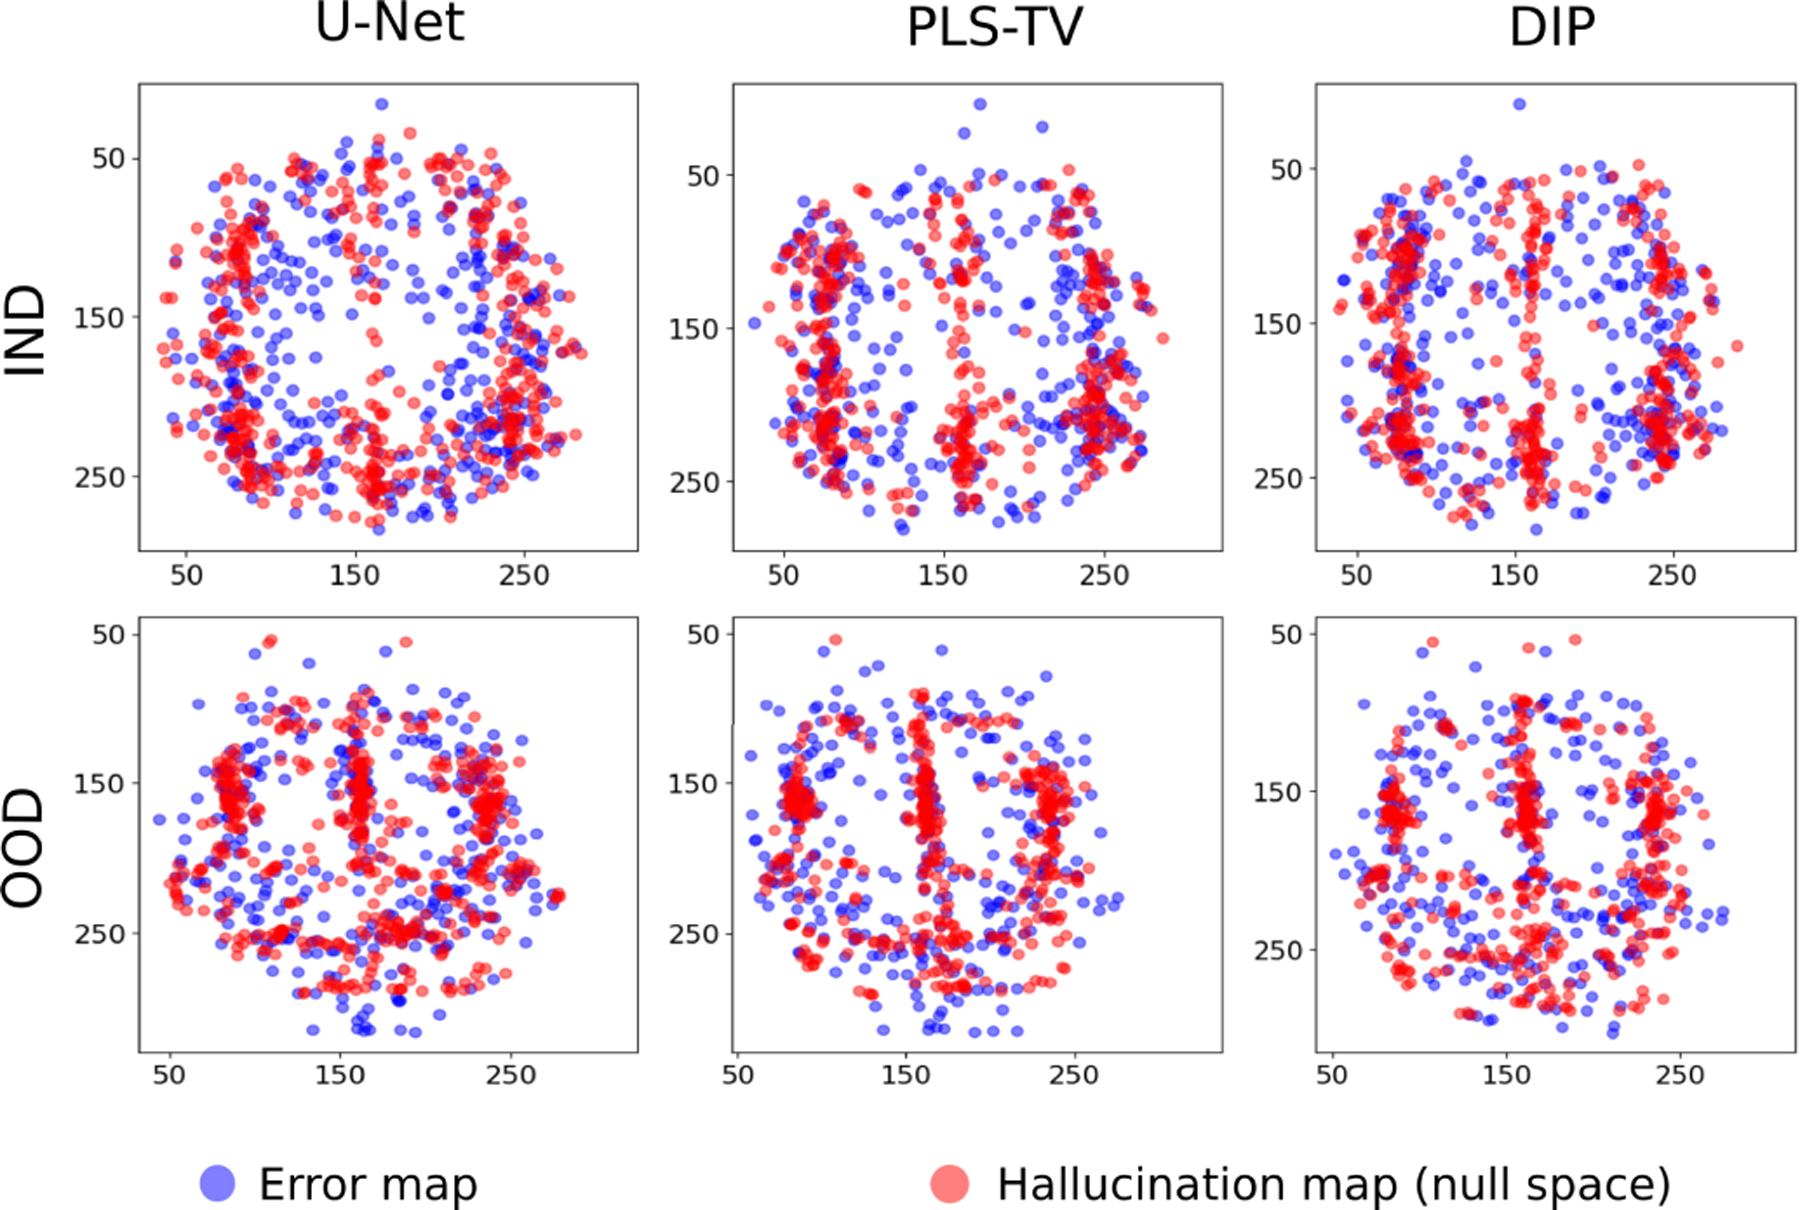
Scatter plots for centroids of localized regions in specific error maps and specific null space hallucination maps with different reconstruction methods for IND (top) and OOD (bottom) data. Note that for each type of data distribution and for all the reconstruction methods, the centroids of the regions detected from the error map have a higher variance compared to the hallucination map as well as some degree of non-overlap.