
Fig. 6.
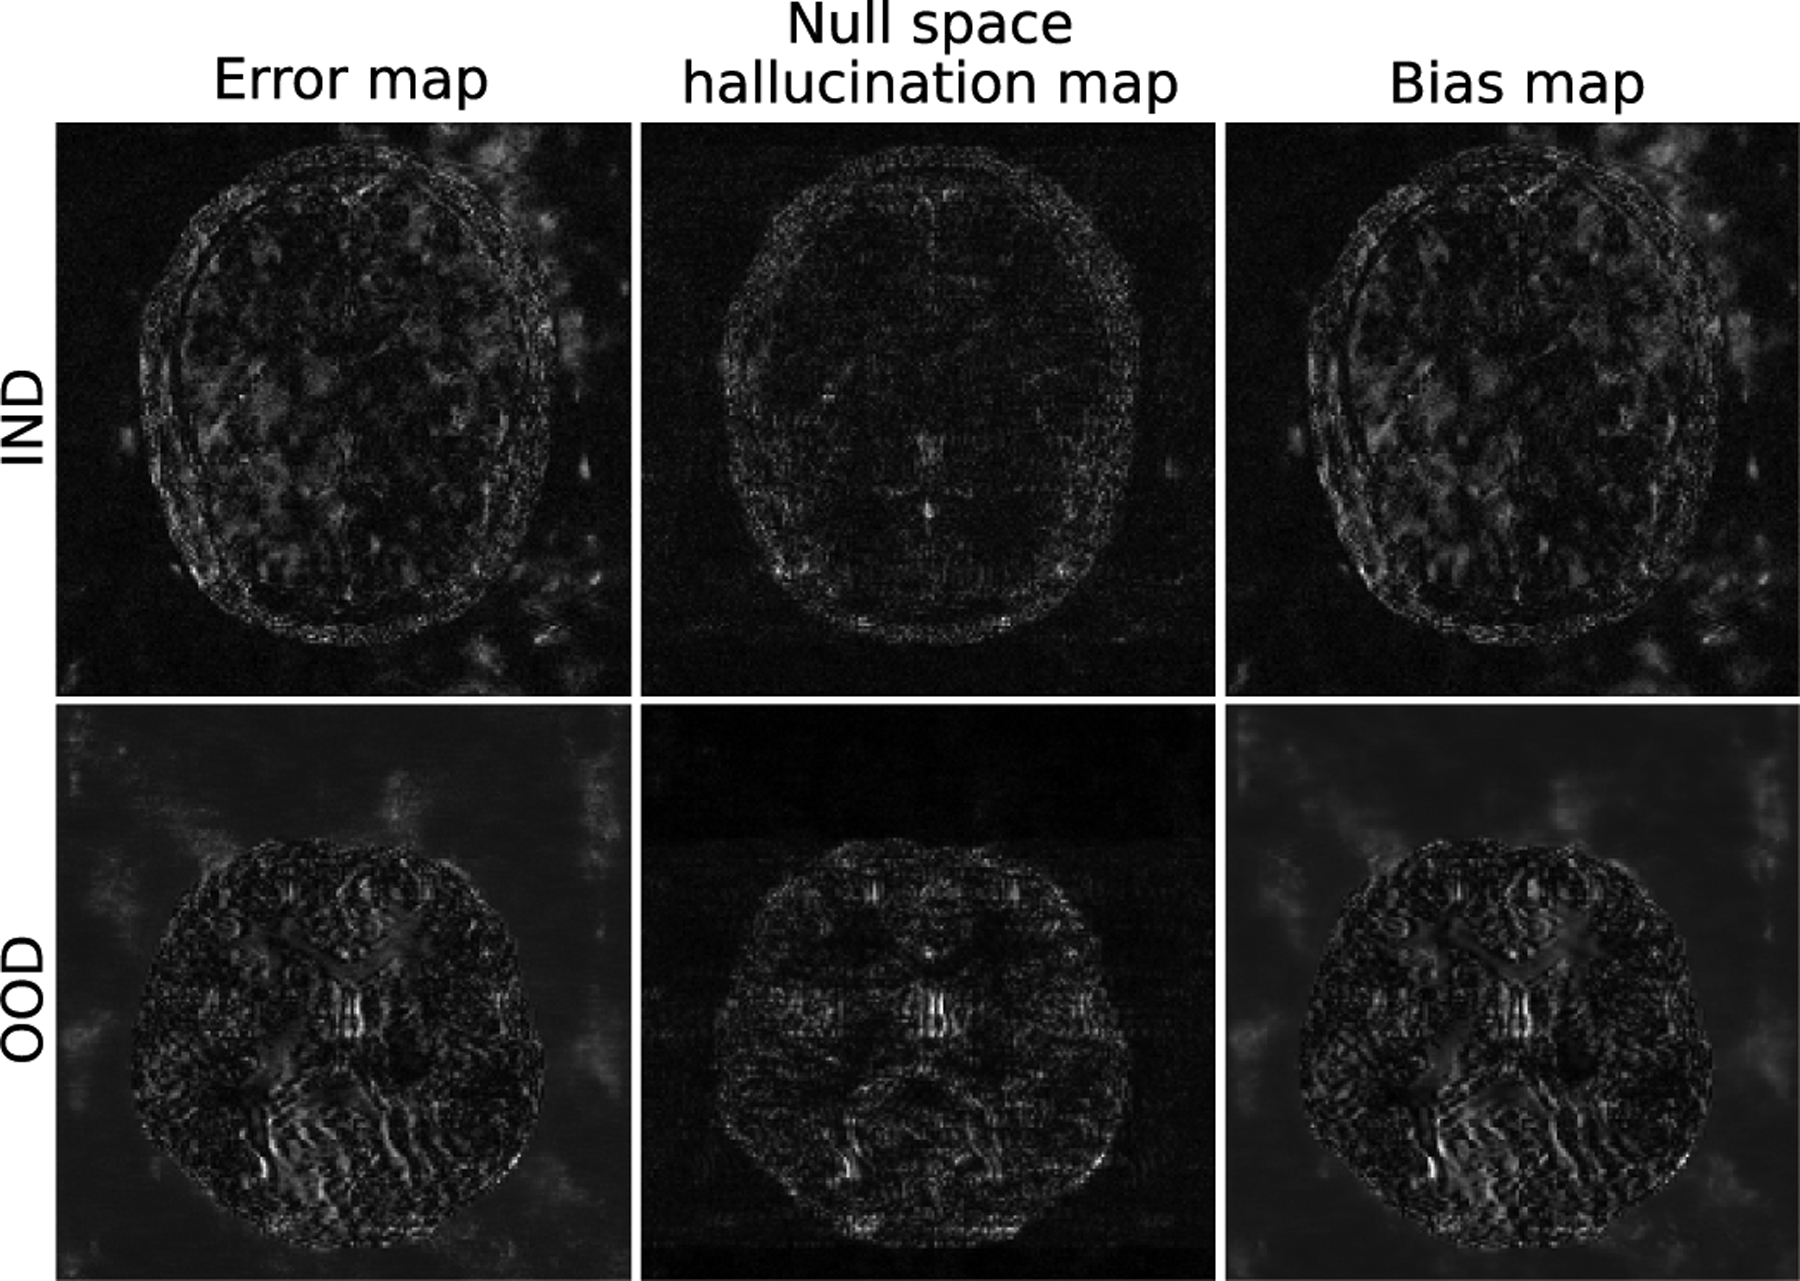
An error map, a null space hallucination map and a bias map for IND and OOD images estimated by use of the U-Net method. The corresponding true objects are shown in Figs. 2 and 1(b) respectively. The bias map was computed over a dataset of 100 images estimated from a single set of simulated measurements with fixed phase noise and different realizations of the iid Gaussian noise. The bias map contains contributions from both the model error, as well as inaccuracies in the prior.