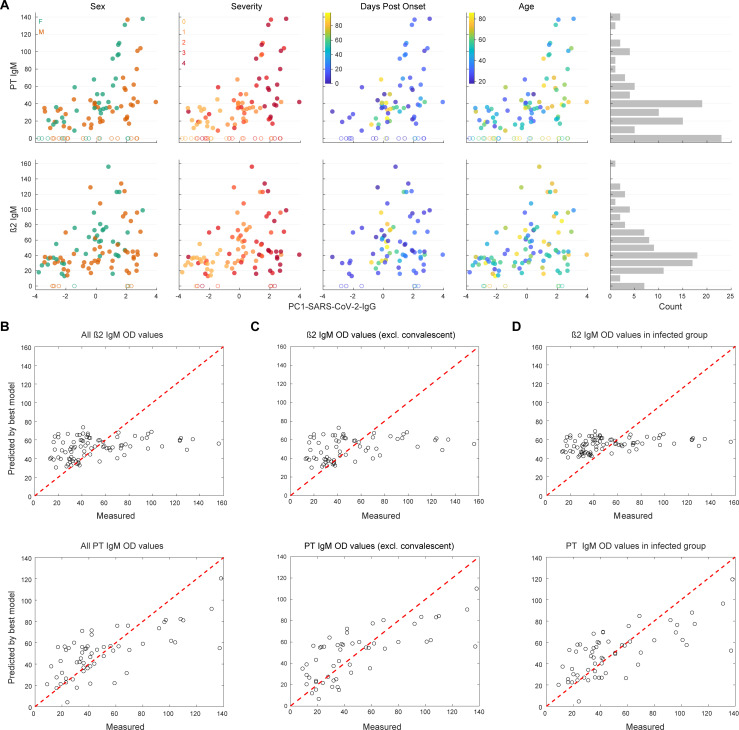
Fig 3. Exploratory multi-parametric data analysis and best-fit model for β2 and PT IgM.
A. Data exploration to inspect potential relationships between OD values for PT or β2 IgM with PC1-SARS-CoV-2-IgG, sex (f for female, m for male), disease severity (scores 0–4), days post onset of first disease manifestation, or age (in years). A histogram of OD values was included to display the relative frequencies. After a peak at ca. OD value 40, a second peak at 0 emerges for both PT as well as for β2 IgM. B. The fitted vs. observed β2 and PT IgM values. While for β2 IgM, only PC1-SARS-CoV-2-IgG is informative, PC1-SARS-CoV-2-IgG, disease severity, and sex, all contribute to the accurate prediction of OD values of PT IgM. C. Same as (B) in the absence of convalescent individuals. D. Same as (B) in the absence of non-infected controls.

