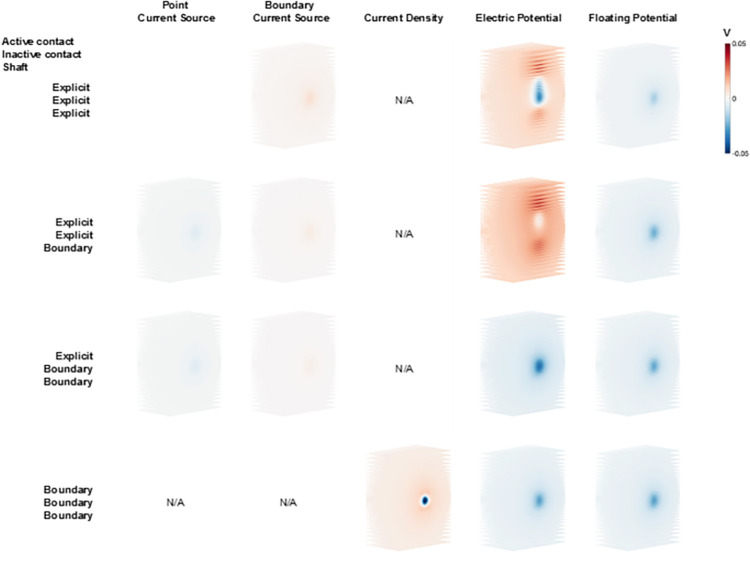
Fig 4. Voltage distribution differences.
Voltage distribution of all model variants relative to Model #1 imposed on a perpendicular axon grid (Fig 3A). All models were solved with the same directional contact set as the active contact at 1 mA. The columns show the different current sources, and the rows show the different geometry presentations of the DBS lead. N/A indicates an inapplicable combination of source and geometry representation.

