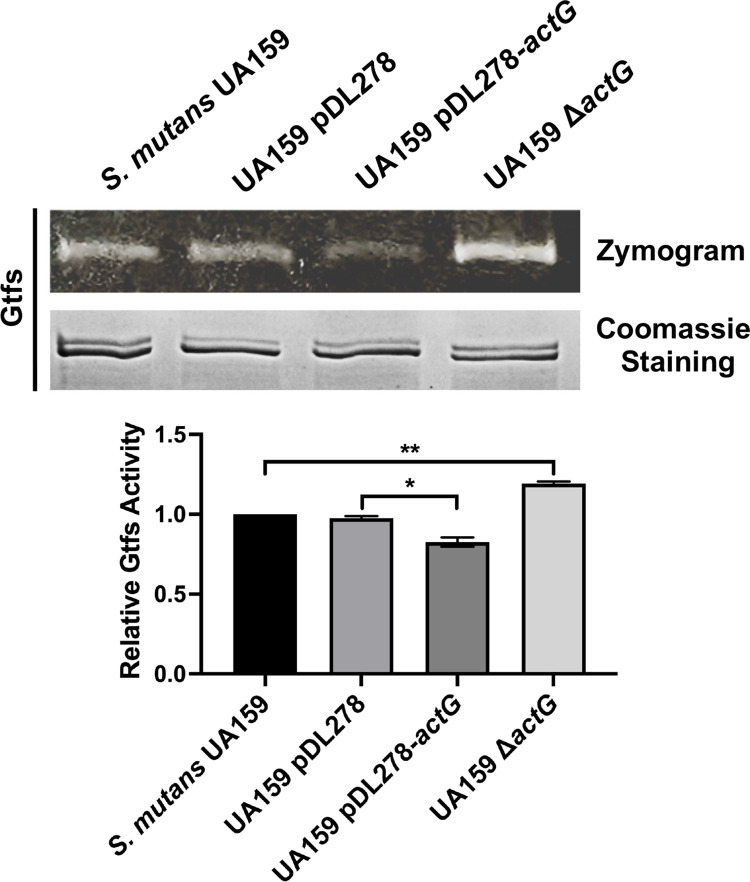
Fig 4.
Effect of actG on Gtfs activities of S. mutans. Gtfs were analyzed for protein amount by Coomassie staining (upper and below) and glucan production by incubating gels with sucrose (upper and above), respectively. The band signals were quantified with Image J software and normalized to the control. Results are presented as mean ± SD (* P < 0.05 or ** P < 0.01).

