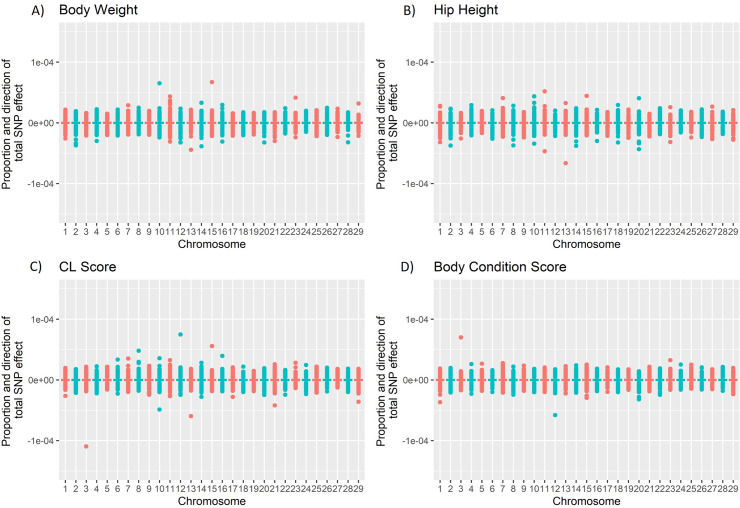
Fig 2. Proportion of total SNP effect described by each marker across the autosomes for each trait.
A positive value indicates a positive directional SNP effect on the trait and a negative value, a negative directional SNP effect on the trait. The proportion of total SNP effect was calculated as where Ei is the effect of the ith marker and ∑|E| is the sum of the magnitudes of all markers for a particular trait. A) Body weight B) Hip Height C) CL score D) Body Condition Score.

