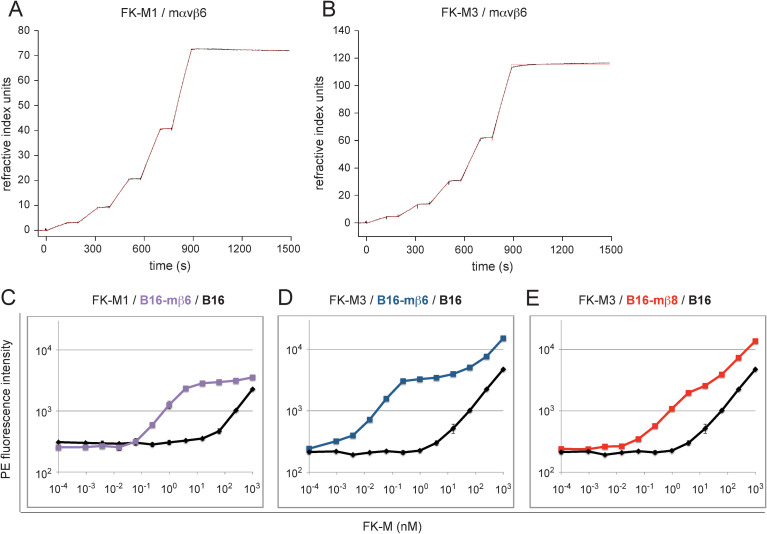
Fig 7. FK affinity determination to sITG αvβ6 and αvβ8 by SPR analysis and to cell surface integrins by saturation binding.
(A, B) Sensor chips containing immobilized biotinylated FK-M1 and FK-M3 were probed with mouse sITG αvβ6. Following consecutive analyte injections over 120 s, dissociation was monitored for 600 s (black). Sensorgrams were fitted with a 1:1 kinetic model (red). (C-E) FK saturation cell binding assays using cells with defined αvβ6/αvβ8 expression included FK-M1 binding to B16-mβ6 (C), FK-M3 binding to B16-mβ6 (D) and FK-M3 binding to B16-mβ8 (E). Parental B16 cells were included in order to subtract background levels when calculating equilibrium dissociation constant KD values by Scatchard plot analyses.

