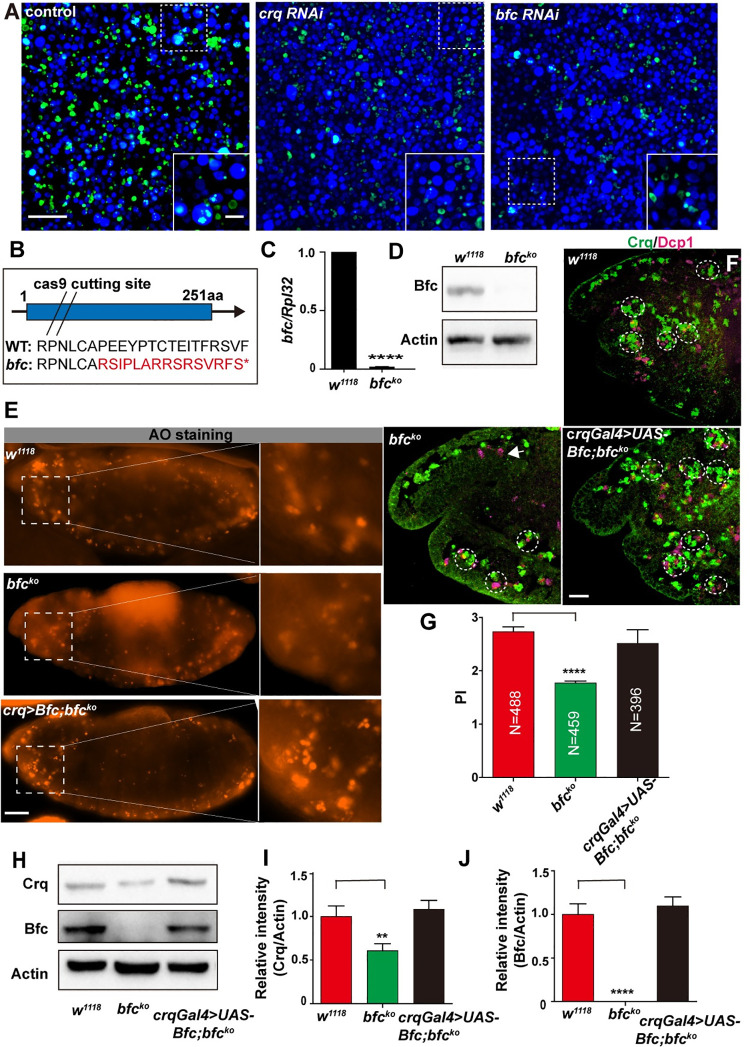
Fig 3. bfc in macrophages and S2 cells is required for efficient efferocytosis.
A. Confocal images showing AC efferocytosis by control-, crq RNAi-, and bfc RNAi-treated S2 cells (the efferocytosis efficiency is quantified in Fig 2C). Live cells are shown in blue, while cells that engulfed FITC-labeled ACs are shown in green. Scale Bars = 50 μm. B. Schematic diagram of the bfcko mutant created by CRISPR/Cas9. The exon is denoted as a blue box, and the transcriptional direction is highlighted with an arrow. The double slash represents the Cas9 cutting site. The red marked amino acids represent the mutated sequence. “*” represents the introduced termination codon. C. The bfc mRNA levels were quantified by qPCR in w1118 and bfcko mutant samples. D. The Bfc protein levels were also quantified via western blotting in w1118 and bfcko mutant samples. Actin was used as the loading control. E. AO-stained wild-type, bfcko mutant, and bfcko mutant re-expressing UAS-bfc (under the control of a crq-Gal4 driver) stage 13 embryos. The insets represent the higher-magnification views of the demarked AO-stained corpses. Scale bar = 20 μm. F. Confocal stacks of the head region of stage 13 embryos on the lateral view. Macrophages and apoptotic bodies were stained with anti-Crq (green) and anti-Dcp1 (magenta) antibodies, respectively in wild-type, bfcko mutant, and bfcko; crqGal4>UAS-bfc embryos, which were imaged using the enhanced similarly to show macrophages. Scale bar = 20 μm. G. Graph showing the mean PI ± SEM for each genotype showed in (F). H. Western blot analysis of the Crq and Bfc protein levels in stage 13 embryos of w1118, bfcko mutant, and bfcko mutant re-expressing UAS-bfc (under the control of a crq-Gal4 driver). Actin was used as the loading control. I-J. Quantification of the Crq and Bfc protein levels in (H) after normalization to the Actin levels; n = 3. Statistical analysis was performed using the student’s t-test(C) and one-way ANOVA(G, I, J).

