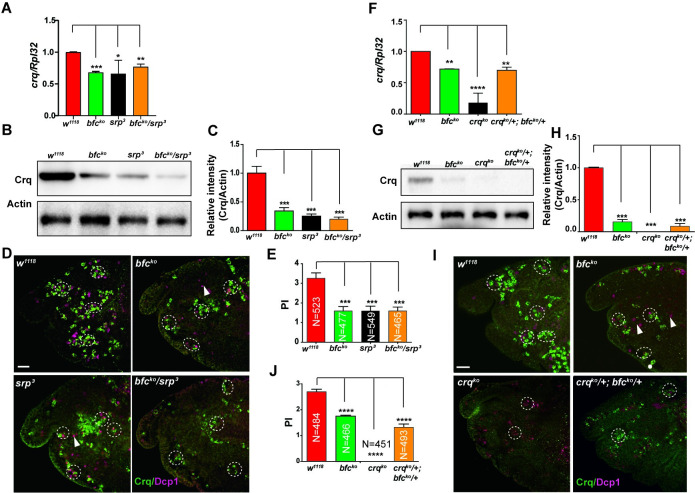
Fig 5. Bfc interacts with Srp to regulate crq expression and efferocytosis.
A. The relative crq mRNA levels were quantified by qPCR in macrophages obtained from wild-type, homozygous bfcko or srp3, and double heterozygous bfcko and srp3 stage 13 embryos. B. Western blot analysis of the Crq protein levels in macrophages of wild-type, homozygous bfcko or srp3, and double heterozygous bfcko and srp3 stage 13 embryos. Actin was used as the loading control. C. Quantification of the Crq protein levels in (B) after normalization to the Actin levels; n = 3. D. Macrophages of wild-type, homozygous bfcko or srp3, and double heterozygous bfcko and srp3 stage 13 embryos were stained with anti-Crq (green) and anti-Dcp1 (magenta) antibodies. Scale bar = 20 μm. E. Graph showing the mean PIs ± SEM for each genotype in (D). F. The relative crq mRNA levels were quantified by qPCR in macrophages of wild-type, homozygous bfcko or crqko, and double heterozygous bfcko and crqko stage 13 embryos. G. Western blot analysis of the Crq protein levels in macrophages of wild-type, homozygous bfcko or crqko, and double heterozygous bfcko and crqko stage 13 embryos. Actin was used as the loading control. H. Quantification of the Crq protein levels in (G) after normalization to the Actin levels; n = 3. I. Macrophages of wild-type, homozygous bfcko or crqko, and double heterozygous bfcko and crqko stage 13 embryos were stained with anti-Crq (green) and anti-Dcp1 (magenta) antibodies. Scale bar = 20 μm. J. Graph showing the mean PIs ± SEM for each genotype in (I). Statistical significance was assessed using the one-way ANOVA.

