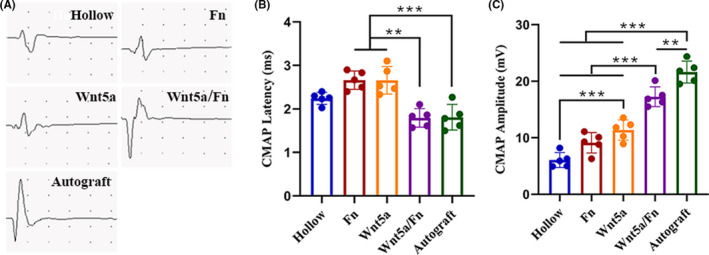
FIGURE 3.

Electrophysiological examination of each group 12 weeks after the operation. (A) Representative images of the CMAPs of each group. (B) CMAP latency of each group. (C) CMAP amplitude of each group. **p < 0.01, ***p < 0.001. Data are expressed as the mean ±SD. CMAP, compound muscle action potential. Fn, fibrin hydrogel group
