
FIGURE 8.
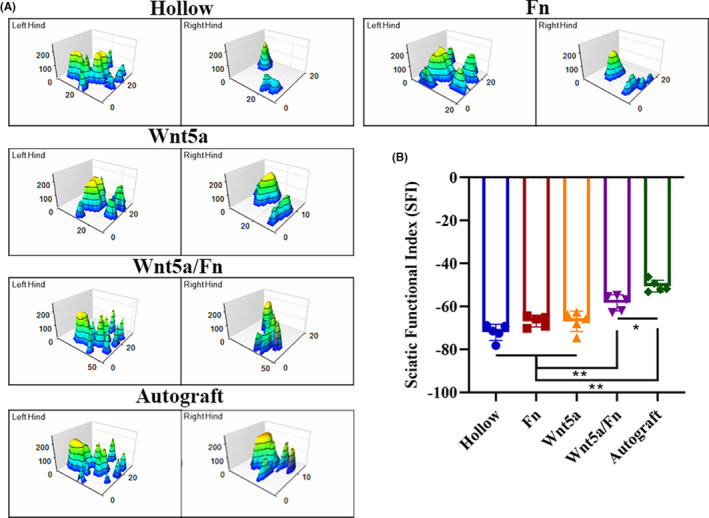
Gait analysis 12 weeks after the operation. (A) Representative three‐dimensional stress diagrams of each group. (B) SFI index of each group. *p < 0.05, **p < 0.01, ***p < 0.001. Data are expressed as the mean ±SD. Fn, fibrin hydrogel group. SFI, sciatic functional index