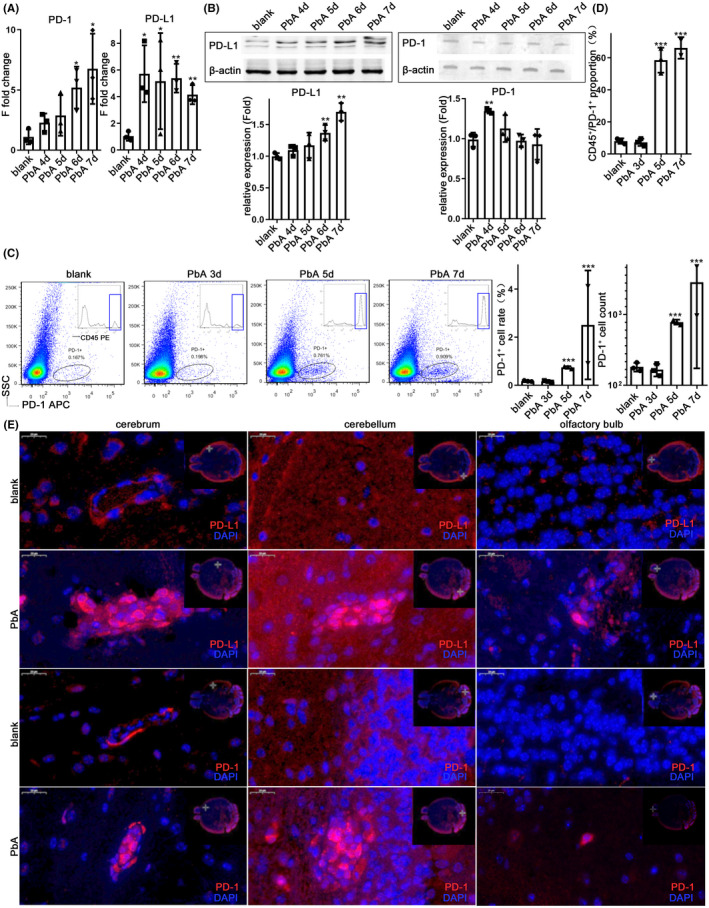
FIGURE 1.

PbA infection induced the PD‐1/PD‐L1 pathway in the brain. The mRNA levels (A) and protein levels (B) of PD‐1 and PD‐L1 in the brain continued to increase 4–7‐day post‐infection (dpi). The microglia were isolated from the infected mice 5–7 dpi or WT mice, followed by anti‐PD‐1 staining. Results of flow cytometry analysis; the percentage and number of PD‐1+ cells analyzed using flow cytometry show an increase in PD‐1+ cells in ECM mice (C), most of which are CD45+(D). (E) Immunofluorescence (IF)‐stained brain sections at 7 dpi show PD‐1+ and PD‐L1+ cells in the brain of ECM mice. Results in (A–D) are expressed as the mean ± SD of three independent experiments. *p < 0.05, **p < 0.01, and ***p < 0.001 indicate that the differences are significant (unpaired t‐test, n = 3)
