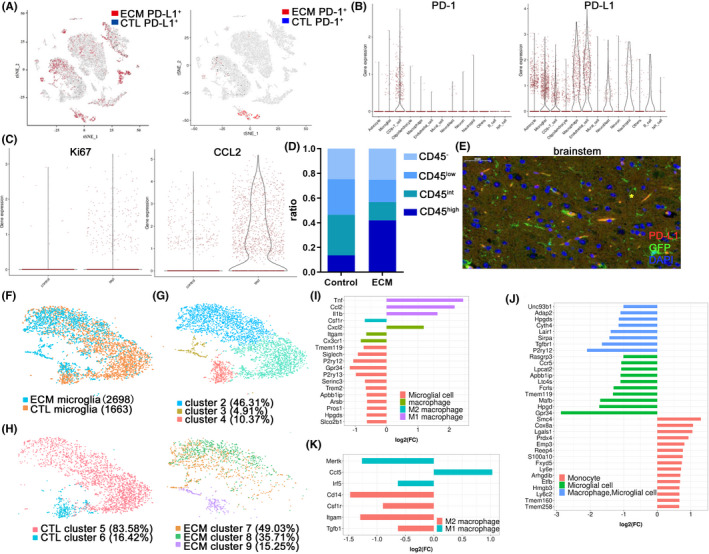
FIGURE 4.

Single‐cell analysis of immune niches in the brainstem of ECM mice. (A) A t‐SNE plot of 9607 individual cells of the brainstem in WT mice (n = 2) and 6,812 individual cells of the brainstem in ECM mice (n = 3) expressed PD‐1 or PD‐L1. Each dot represents a single cell. The color corresponds to the level of transcription. (B) Combined log‐normalized expression values of PD‐L1 or PD‐1 in various cell types of the brainstem in ECM mice based on t‐SNE data. (C) Expression values of Ki67 and CCL2 in microglial cells of the brainstem in ECM mice compared with those in the WT mice. (D) Expression of CD45 in microglia increased significantly in the ECM brainstem and the proportion of CD45high cells increased. (CD45low, CD45int, and CD45high indicates log2 < 1, 1 ≤ log2 value of <2, and log2 value of ≥2, respectively). (E) IF‐stained CX3CR1‐GFP brain sections at 7 dpi demonstrate that microglia expressed PD‐L1 in the brainstem (asterisk). The microglia showed heterogeneity between the ECM and WT mice (F) and were divided into three clusters (G). (H) Physiological microglia were divided into two clusters, while the microglia of ECM mice were divided into three clusters. Gene expression analysis showed that the M1 polarization gene of macrophages was higher in Cluster 7 of ECM mice than in Cluster 5 of normal mice (I), the monocyte genes increased in Cluster 9 compared with Cluster 7 of ECM mice (J), and most of the M1/M2 macrophage genes declined (K)
