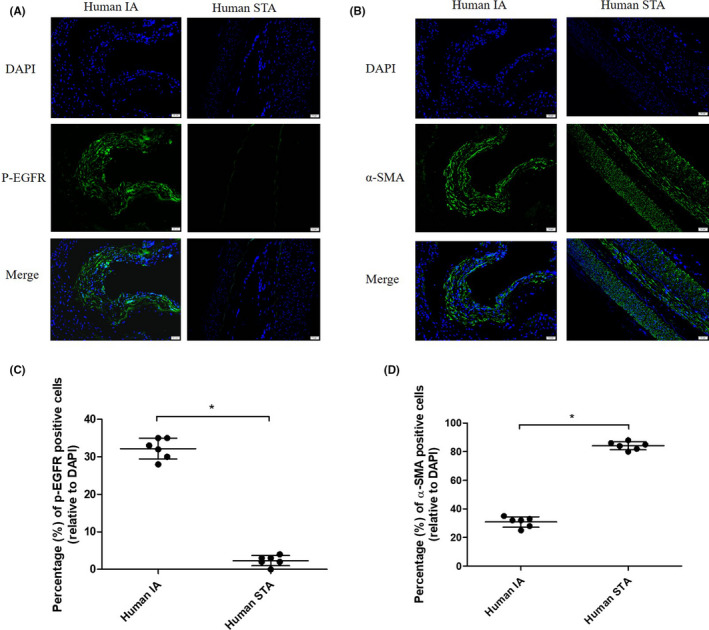
FIGURE 1.

p‐EGFR (Tyr1068) and α‐SMA distribution in human intracranial aneurysm (IA) and superficial temporal artery (STA). (A,B) Representative images were shown. STA and IA were labeled with antibodies against α‐SMA (green) and p‐EGFR (green) and stained with DAPI (blue). (C,D) Quantitative analysis of cells positive for p‐EGFR and α‐SMA. *p < 0.05 vs. STA. EGFR, epidermal growth factor receptor [Colour figure can be viewed at wileyonlinelibrary.com]
