
FIGURE 2.
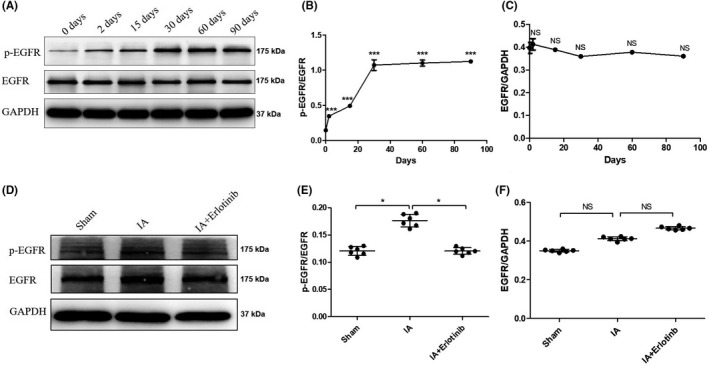
EGFR phosphorylation in the brain vessels of Willis circle of rat intracranial aneurysm (IA) models. (A) At days 2, 15, and 30, the arteries were taken for Western blot analysis of p‐EGFR and total EGFR. (B) Expression of p‐EGFR was quantified by densitometry and normalized by expression of EGFR. ***p < 0.001 vs. 0 Day. (C) Expression of EGFR was quantified by densitometry and normalized by expression of GAPDH. NS p > 0.05 vs. 0 Day. (D) With the treatment of Erlotinib for 30 days, the arteries were taken for p‐EGFR and EGFR by Western blot. (E and F) The expression levels of p‐EGFR and EGFR were quantified and normalized. NS p > 0.05; *p ≤ 0.05. Data are mean ± SD, n = 6. EGFR, epidermal growth factor receptor