FIGURE 3.

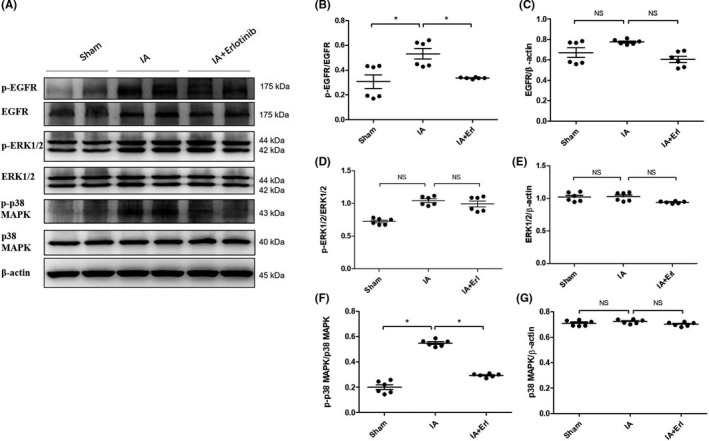
EGFR activation and downstream signals in the cerebral arteries of rat intracranial aneurysm (IA) models with the treatment of erlotinib. (A) At months 3, the arteries were taken for analysis of p‐EGFR, EGFR, p‐Erk1/2, Erk1/2, p‐p38MAPK, and p38MAPK. (B, D and F) The expression levels of p‐EGFR, p‐Erk1/2, and p‐p38MAPK were quantified and normalized by their unphosphorylated forms. NS p > 0.05; *p ≤ 0.05. (C) (E and G) The expression levels of EGFR, Erk1/2, and p38MAPK were quantified and normalized by β‐actin. NS p > 0.05. Data are represented as the mean ± SD, n = 6. EGFR, epidermal growth factor receptor
