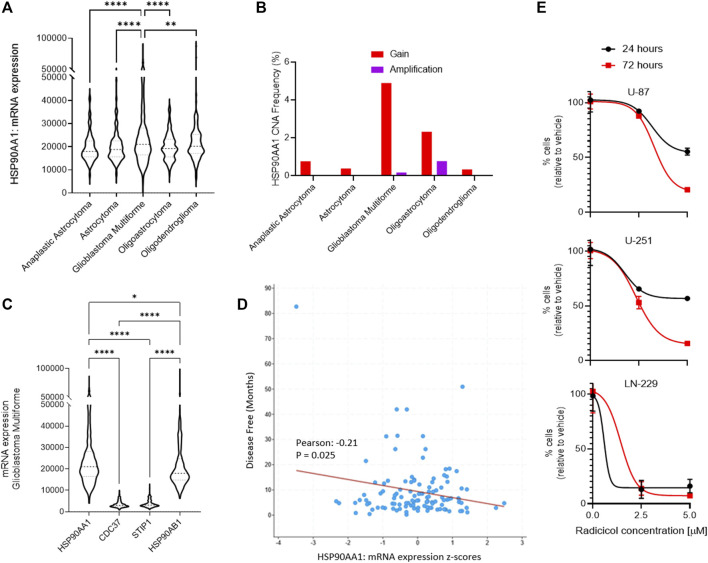
FIGURE 1.
Role of Hsp90 in glioblastoma multiforme (GBM) across CNS tumors. (A) HSP90AA1 mRNA expression (RNA Seq V2 RSEM) [log2(value + 1)] compared across five clinical studies (cBioPortal). **p<0.01, ****p<0.0001 analyzed by ordinary one-way ANOVA with Tukey’s multiple-comparison test. (B) Copy number alteration (CNA) evaluated across seven clinical studies (cBioPortal). (C) GBM clinical datasets and TCGA data were queried to compare multiple Hsp90-related chaperone and co-chaperone gene expressions by mRNA. *p<0.05, ****p<0.0001 analyzed by ordinary one-way ANOVA with Tukey’s multiple-comparison test. (D) Dot plot comparing disease-free survival with Hsp90 mRNA gene expression from two GBM clinical datasets (cBioPortal). The line indicates simple linear regression. Pearson’s coefficient is statistically significant. (E) Cell kill curves of three high-grade glioma/GBM cell lines following treatment with the Hsp90 inhibitor, radicicol, for the indicated amount of time and concentration. N=3 in biological replicate.

