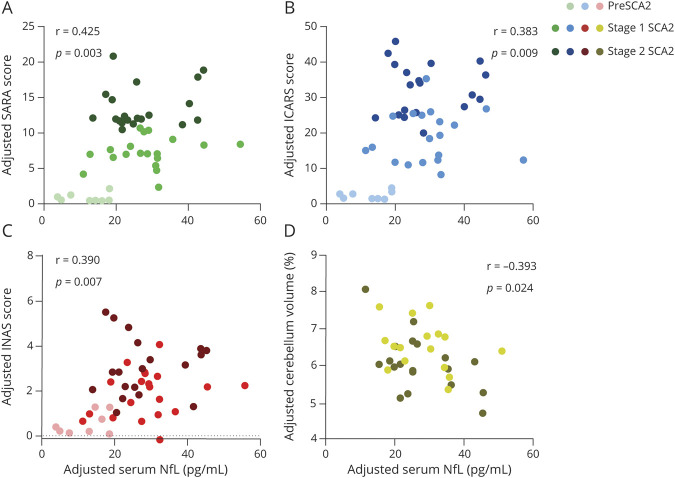
Figure 4. Association Between NfL Levels and Disease Severity in Individuals With SCA2.
Elevated serum neurofilament light (NfL) levels were significantly associated with worse Scale for the Assessment and Rating of Ataxia (SARA) scores (A), worse International Cooperative Ataxia Rating Scale (ICARS) scores (B), worse Inventory of Non-Ataxia Signs (INAS) scores (C), and smaller cerebellum volumes (D). The patients with manifest spinocerebellar ataxia type 2 (SCA2) were classified into 2 subgroups based on median SARA scores and clinical features: stage 1 (3 ≤ SARA score <11) and stage 2 (SARA score ≥11). All volumetric measures were calculated as percentages of total intracranial volumes. Partial p and r values were obtained after adjustment for age.

