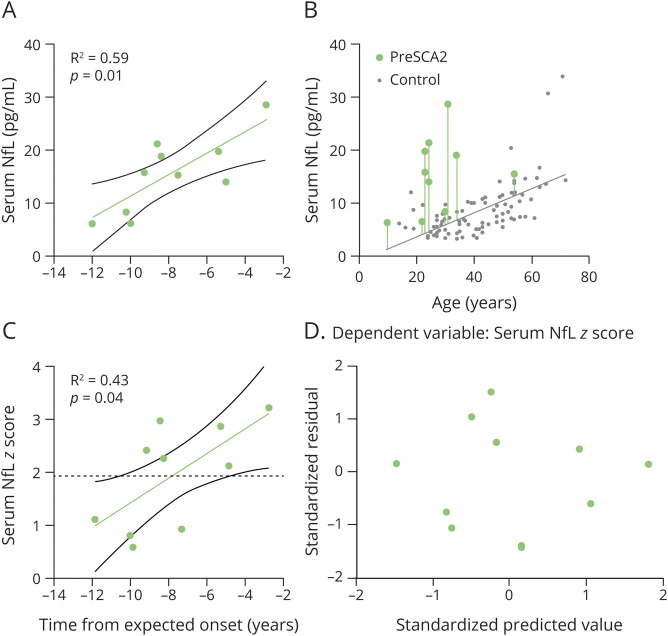
Figure 5. Association Between Serum NfL and Time From Expected Onset in preSCA2.
(A) Serum neurofilament light (NfL) levels were significantly higher close to the predicted age at ataxia onset in preclinical spinocerebellar ataxia type 2 (preSCA2), as revealed by a linear regression between NfL levels and time from expected onset. (B) To compare individuals with preSCA2 and controls at the same age, measured NfL levels were expressed as NfL z scores. Difference between the measured NfL level (green dot) and the NfL level estimated for controls at the same age (solid gray line) is visualized by the length of vertical line. Standardization of this difference relative to the NfL distribution in controls yields the individual NfL z score. (C) The NfL z score was significantly higher close to the expected age at onset in preSCA2, not overlapping the 95% confidence interval of controls (i.e., z score > 1.96, dashed black line) already 4.8 years before the estimated age at onset. (D) Residual plot for the linear regression of serum NfL z score exhibits a random scatter.

