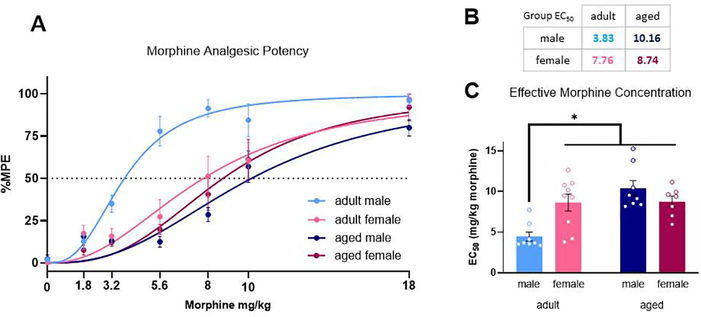
Fig. 2.
Morphine dose response curve following cumulative administration (A). EC50 values were generated from nonlinear regression analysis (B). Adult males exhibit lower morphine EC50 values than females and aged males (C). Data presented in milligrams of morphine per kilogram of body weight. *Significant differences between adult male and adult female, adult male and aged male, and adult male and aged female. p<0.05 calculated by Tukey’s post hoc test. Graphs indicate mean ± SEM.

