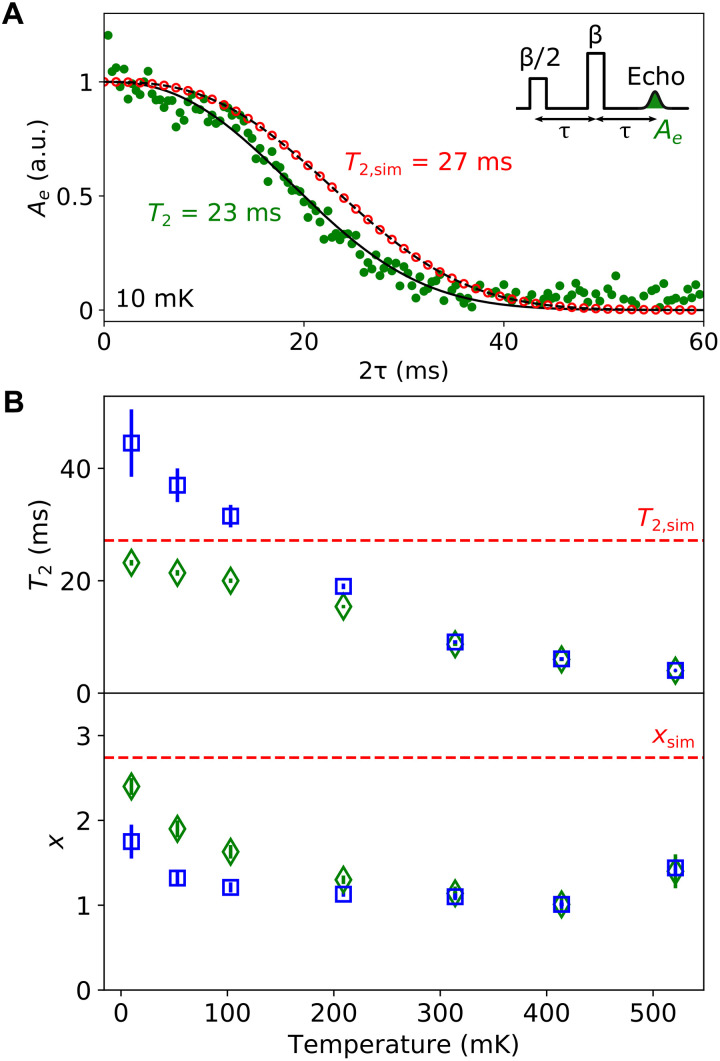
Fig. 2. Er3+ electron spin coherence time T2.
(A) Measured normalized Hahn echo integral Ae (green full circles) as a function of the delay 2τ between the first pulse and the echo, at 10 mK cryostat temperature, φ = 47∘ and high pulse power (β = 700 ns−1/2). Each data point is magnitude averaged over 60 measurements with a repetition time of 4 s. The solid black line is a fit to (with the offset C subtracted from the data and the fit), yielding T2 = 23.2 ± 0.5 ms and x = 2.4 ± 0.1. Open red circles are the result of a cluster-correlation expansion (CCE) simulation of the nuclear spin bath for the same field orientation. The dashed black line is a fit to the simulation, yielding T2, sim = 27.2 ms and xsim = 2.74. (B) Measured coherence time T2 and exponent x (green diamonds) as a function of the cryostat temperature. The red dashed line is the result of the CCE simulation. The blue squares result from a second fit of the data as to extract the net decoherence effect of spectral diffusion due to paramagnetic impurities.

