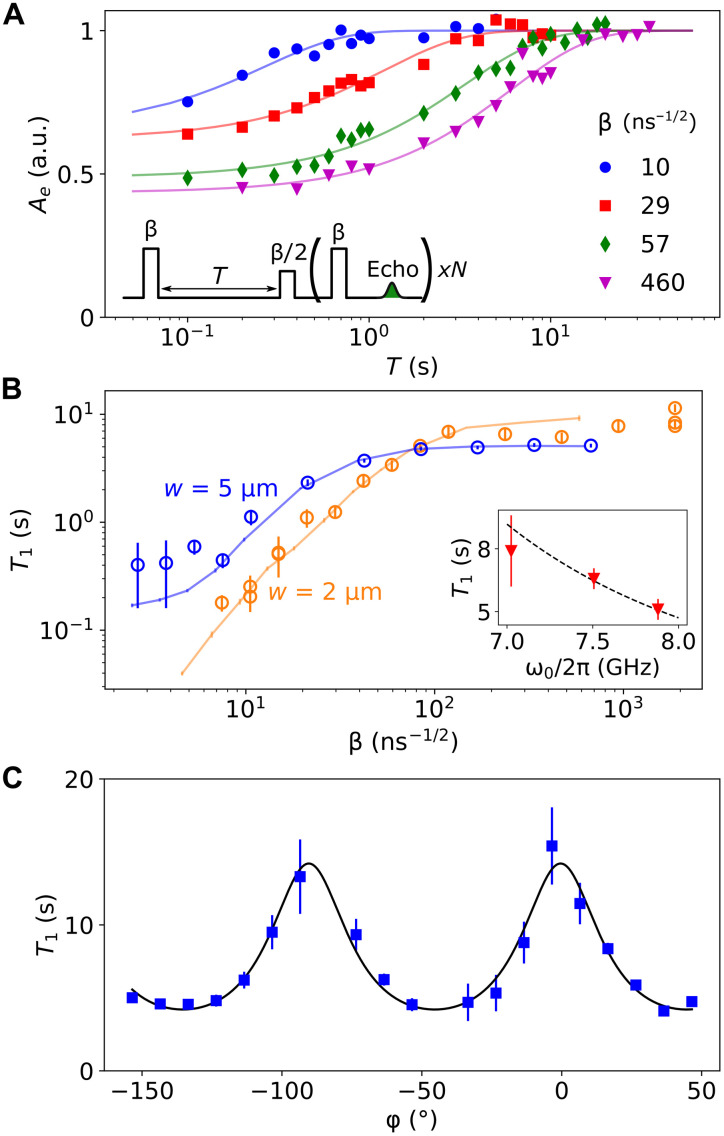
Fig. 3. Spin relaxation time T1.
(A) The inversion recovery sequence includes a first pulse of amplitude β, followed after a delay T by a Hahn echo detection sequence also of amplitude β. The last pulse and the echo are repeated N times for enhanced signal averaging (see Materials and Methods). Solid symbols are the measured echo integral Ae as a function of T, for various values of β shown in the figure. Solid lines are exponential fits, yielding the spin relaxation time T1. The data are measured with the 2-μm-wide inductor resonator. In (A) and (B), φ was set to 30∘ to maximize the signal. (B) Measured values of T1 as a function of β for a 2- and 5-μm-wide inductor resonator (open circles). The solid lines result from simulations where the only adjustable parameters are the input line attenuation and the spin-lattice relaxation time (see section S1.10). Inset shows the measured phonon-limited T1 for all three resonators (red triangles). The black dashed line indicates that the data are compatible with a dependence of Γsl as (38). (C) Measured T1 (squares) at high input pulse amplitude (β = 700 ns−1/2) as a function of φ for the 5-μm-wide inductor resonator. The solid black line is a fit with (T1)−1 = A + B sin (4φ + φ1), as described in (39), where φ1 is found to be 92∘ ± 3∘.

