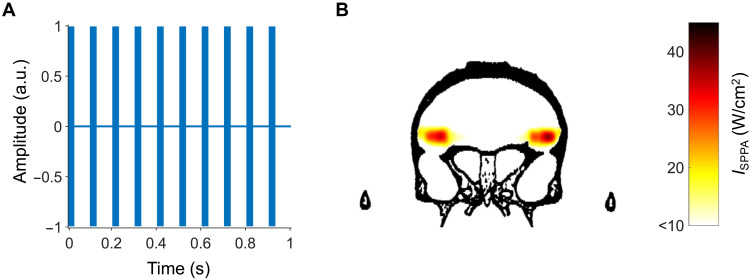
Fig. 2. Estimated peak intensities and spatial distributions of ultrasound based on a high-resolution macaque whole-head computed tomography scan.
(A) Before each session, the TUS protocol consisted of a 40-s ultrasonic stimulation with a rectangular envelope over a train of pulses: The pattern displayed was repeated 40 times. Within the ultrasonic stimulation pulse train, each pulse had a pulse duration of 30 ms and a pulse repetition interval (PRI) of 100 ms for a duty cycle of 30%. The pulse repetition frequency (PRF) within the stimulus duration was 10 Hz. PRF = 1/PRI. a.u., arbitrary units. (B) Simulated focused ultrasound peak intensities and spatial distribution in the brain when targeting right and left area 47/12o, based on a high-resolution macaque whole-head computed tomography scan. The maximum spatial-peak pulse-averaged intensity (ISPPA) at the acoustic focus point was 42.6 W/cm2 for the left area 47/12o target and 34.6 W/cm2 for the right area 47/12o target. aPFC TUS protocol was the same as the one we previously used in (8). Because the beams do not overlap, there is no region of dark red as we have estimated that there has been in some of our previous studies, in which beam overlap was intended (9). TUS occurred several minutes before the behavioral task was performed. Such a stimulation protocol is often referred to as an “offline protocol.”

