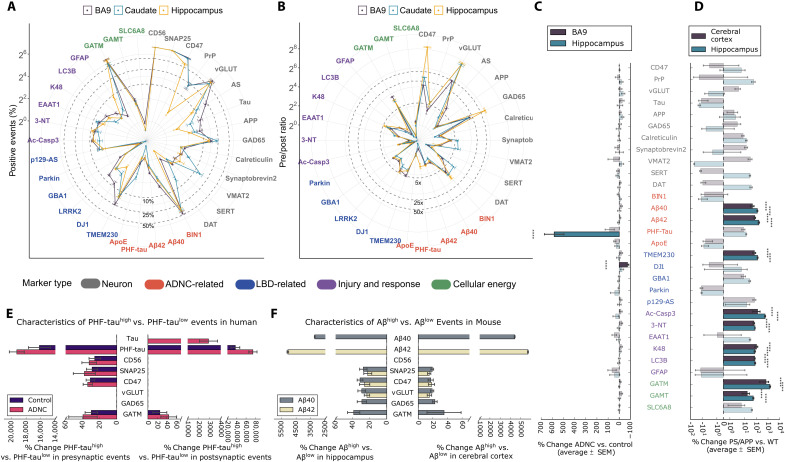
Fig. 1. SynTOF panel results for human and mouse synaptosomes analyzed as average % positive events (±SEM).
Our 38-antibody panel comprises the 30 antibodies listed in (C) plus six gating antibodies (CD11b, MBP, CD56, SNAP25, PSD95, and gephyrin) plus two antibodies (AS and LRRK2) that did not label both human and mouse tissue. See table S2 for additional information, including how these antibodies were grouped into marker types that identify features such as cell type, synapse type, AD, or PD risk gene protein products. In all panels, font color for each antibody indicates which marker type it belongs to: neuron (gray), ADNC-related (red), LBD-related (blue), injury and response (magenta), and cellular energy (green). (A) Spider plot of % positive events from BA9, caudate nucleus, and hippocampus from human Control (n = 6). (B) Spider plot of presynaptic/postsynaptic event ratios for nonzero postsynaptic markers. (C) Presynaptic average % change in % positive events (±SEM) in BA9, caudate, and hippocampus from human Control, ADNC (n = 9), and LBD (n = 6) analyzed by two-way analysis of variance (ANOVA) with brain region versus diagnostic group. The bars in bold colors with asterisks present the results with significant differences (P < 0.001). Results for LBD samples are presented in text. (D) Similar to (C) but for cerebral cortical and hippocampal presynaptic results from 22-month-old PS/APP (n = 5) versus WT (n = 5) mice. (E) Hippocampus presynaptic and postsynaptic % change in mean intensity (±SEM) in both Control and ADNC samples analyzed by two-way ANOVA with PHF-tauhigh or PHF-taulow versus mean intensity for each probe. Only significantly greater mean intensity following correction for multiple comparisons is presented. (F) Similar to (E) but for hippocampus or cerebral cortex presynaptic events in PS/APP mice divided into Aβ40high versus Aβ40low events or Aβ42high versus Aβ42low events.

