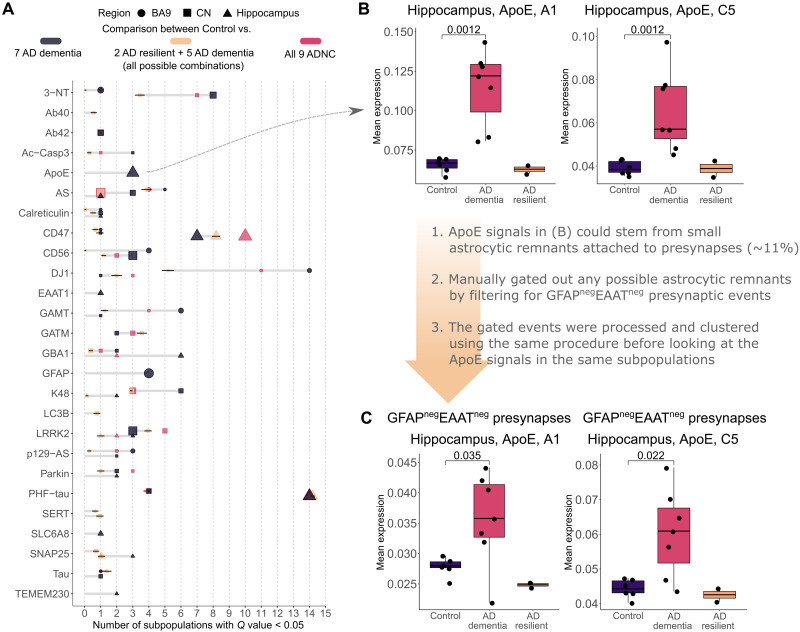
Fig. 4. Changes in significant features and signal strength within AD dementia cases.
(A) Number of significant subpopulations after FDR adjustment (Q < 0.05) for each of the expression markers in different brain regions. The dark gray color indicates comparison between seven AD dementia cases and all Control cases. Tan is between all combinations (n = 36) of all Control cases and seven ADNC cases, i.e., five of seven AD dementia plus the two AD resilient, and therefore presented with SDs. For reference, the red color indicates the original comparison between all nine ADNC cases and the Control. The larger dot size indicates lower Q value. Only markers with significant subpopulations are shown. (B) Boxplots of the strongest, newly emerged signals for Control versus AD dementia only cases: ApoE expression from two subpopulations in the hippocampus. (C) Investigation into ApoE signals similar to (B) but looking strictly at presynaptic events with no astrocytic remnants. Data in (A) and (B) include the approximately 11% of events that contained attached astrocytic remnants. To assess the extent to which ApoE expression derived from neuronal events only versus the subset of presynaptic events with astrocytic remnants, we repeated our analysis with the GFAPnegEAATneg filters incorporated into the previously used presynaptic gating strategy, followed by the same clustering, processing, and analyses. The results showed reduced effect size compared to all presynaptic events (B) but still remained significant, suggesting that the ApoE signal derived from both neuronal presynapse and astrocytic remnant components of the single-event data.

